
TRADING DASHBOARD & APM · 3 OF 8 · DAILY MONITORING
Read account totals in context.
Start with the selected account and broker connection. Then move from account-wide balances to the strategies using those funds.
← Trading Dashboard guide · Use the overview to choose a different task.
Confirm the account and connection
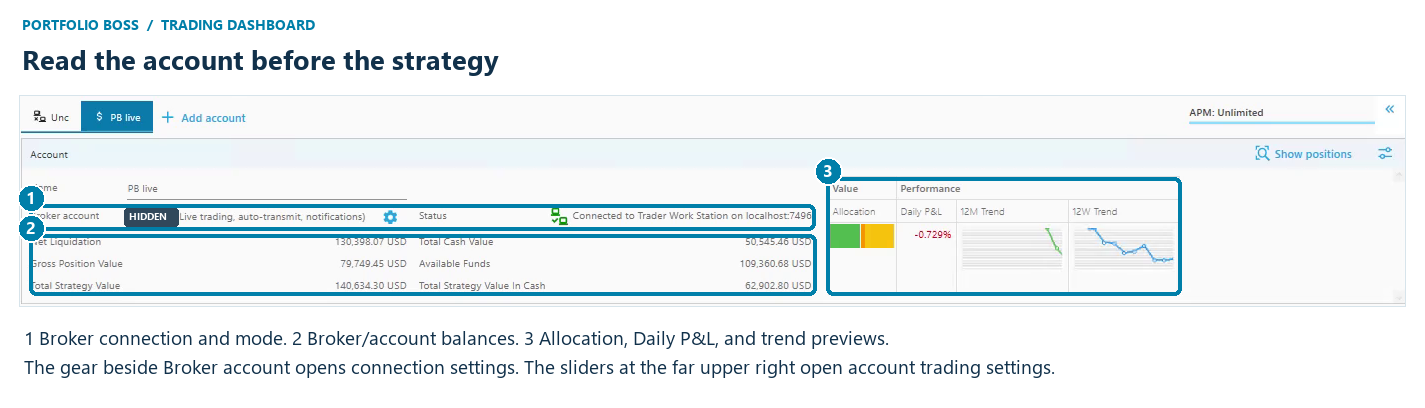
Select the appropriate account tab. Read its name and Broker account line, including paper/live mode and transmission information. The Status area shows the broker connection; the demonstrated live account is connected to TWS on localhost:7496. Use your account’s actual status, not the presence of historical balances, to judge the connection.
Keep broker balances and strategy values separate
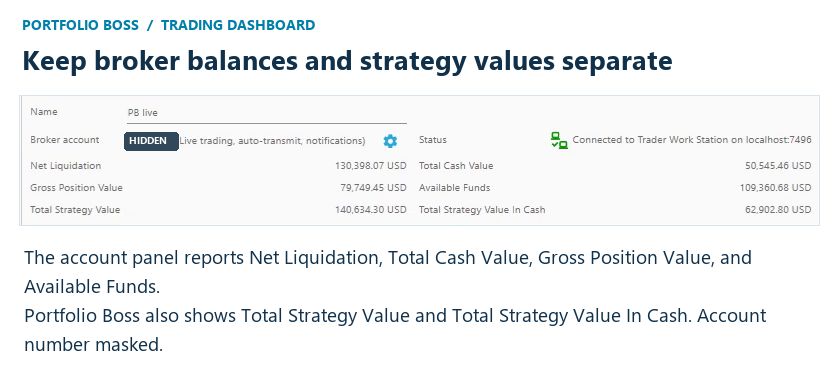
| Field | How to read it |
|---|---|
| Net Liquidation | The broker’s reported overall account value. |
| Gross Position Value | The broker-reported value of positions, shown separately from cash. |
| Total Cash Value | The cash balance reported for the broker account. |
| Available Funds | The broker’s available-funds figure. Treat it as its own account field, not as a synonym for Total Cash Value. |
| Total Strategy Value | The total value tracked for the strategies assigned to this dashboard account. |
| Total Strategy Value In Cash | The cash component tracked within those strategies. |
The broker describes the account as a whole; Portfolio Boss also tracks how value is assigned within strategies. If something looks inconsistent, inspect the strategy’s funding and holdings, then use Show positions to compare broker shares and strategy assignments.
Use allocation colors and trend previews for orientation
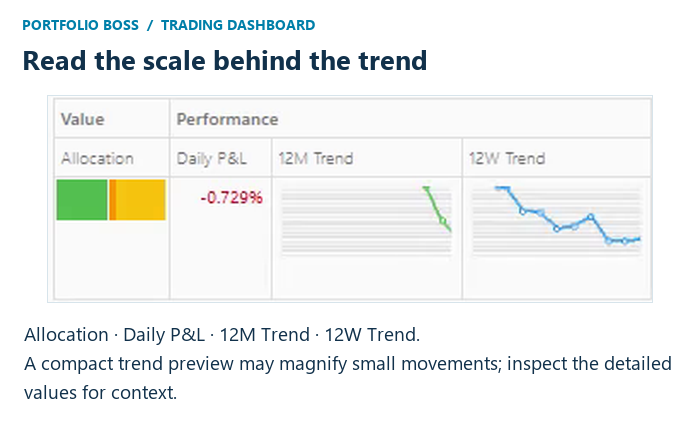
The account panel summarizes allocation across its strategies. Each strategy row has its own allocation and performance information. Click a strategy’s allocation area to open the detailed historical value chart and position table.
| Chart legend | Meaning in the demonstrated strategy |
|---|---|
| Green — Default positions | Positions held in the strategy’s default allocation. Dan describes these as the regular long positions in this example. |
| Orange — Cash equivalent positions | Positions classified in the strategy’s cash-equivalent portion. Dan’s example includes inverse ETFs here. The label does not mean the instrument is risk-free or the same as cash. |
| Yellow — Cash | Cash tracked in the strategy. |
Use the chart’s actual legend as the authority for its colors. An orange segment is not a universal “short trade” signal, and a green segment is not a profit indicator. For exact dates and values, open Strategy details and hover over the historical chart.
Daily P&L reports the displayed day’s change. 12M Trend and 12W Trend are compact trend views. Dan points out that a zoomed-in preview can make a small move look dramatic, especially with a short trading history. Check the numbers and date range before interpreting the picture.
Understand the APM indicator
The upper-right APM indicator shows the plan in use; Dan’s recording shows APM: Unlimited. He explains that APM plans relate to the amount managed across connected Interactive Brokers accounts. Use your current plan information for limits and pricing. A strategy pack’s license and an APM plan are separate things to check when adding strategies.
Based on Dan’s November 6, 2026 walkthrough in Portfolio Boss Unite 6.0.0.71. Screenshots show an example account and historical values, not recommended allocations or expected returns. Brokerage account identifiers have been masked. Labels and available features can vary by version and license.


Responses