Backtest Panel
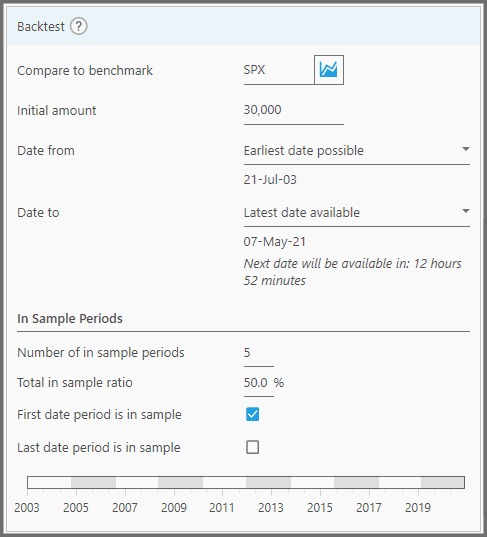
This Panel is used for defining the strategy's backtest range (time period), and the index (benchmark) to compare against. You can also define the in-sample and out-of-sample periods for the backtest, so you'll know how the strategy performs in uncharted waters. By comparing its performance between the two different time periods, you'll know whether the strategy stays consistent.
This Panel is located at the bottom of the Rules Area (on the “Backtest Strategy” page).
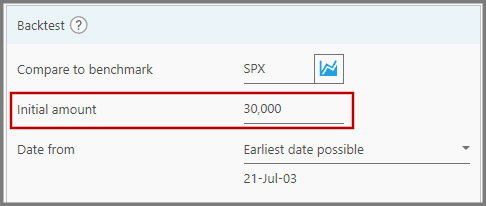
1. To define an index (benchmark) to compare against the strategy's performance, use the property “Compare to Benchmark”. Obviously, the benchmark must be related to the strategy's Portfolios, so that the statistical results are comparable.
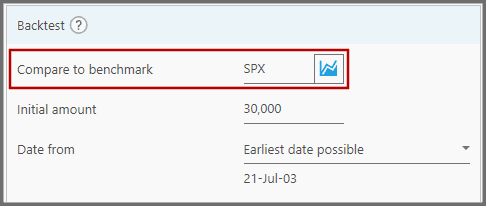
For example, if you're trading stocks, you don't want to input a commodity index in here. Instead, input something like the SPX (for S&P 500) or RUI (for Russel 1000). The benchmark you set here will be shown on the “Chart” Tab (the blue graph).
Simply type in the symbol in this parameter (or any search terms); a dropdown menu then shows up listing the instruments that match your search. Look at the Asset-Class column (2nd from the right) to see whether the instrument is an index, and choose the one you want.
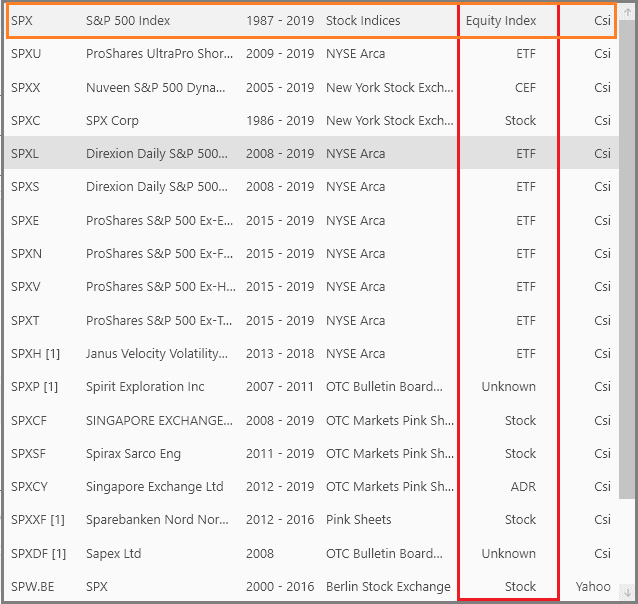
If you're sure the symbol you typed here is correct, simply press enter on your keyboard without selecting from the dropdown. You can also input an ETF here instead of an actual index (let's say QQQ for representing the Nasdaq 100 index). Note, the longer the benchmark has been around, the longer your backtest range will be, thus yielding a more accurate result.
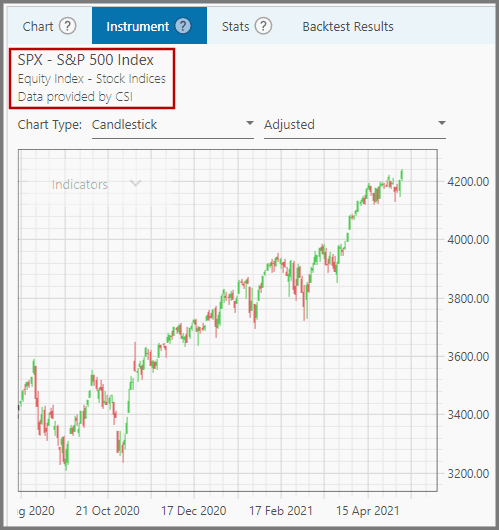
To view the historical price data of that index, simply click the little “Chart” button  at this property. You'll be taken to the “Instrument” Tab (at the Reports Area) where you can see the price chart.
Note, you can't input a delisted instrument here (a symbol with a number suffix within the square brackets). If you do so, there's a warning on this property, and your strategy becomes invalid (it can't be backtested):

2. On the “Initial Amount” property, you can enter your initial account balance in dollar value (it's optional, you can leave it at 0).
You can see how much that initial capital grows during the whole backtest period by looking at the Metrics Tab (located at the Reports Area), on the item “Total Amount” .
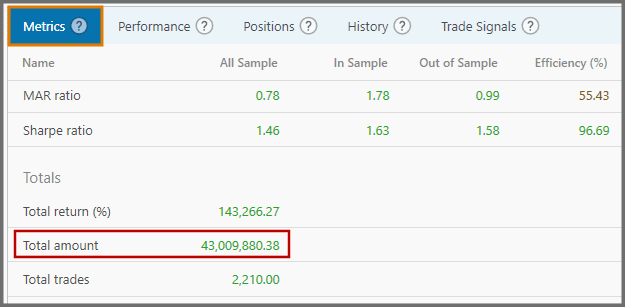
This is the total money you'd get if you were to trade with this strategy for the same period.
3. “Date From” property: here you can set how far back the backtest will be processed. Usually, you want to set this to “Earliest Date Possible”, thus the backtest period will be stretched to the oldest date allowed by the strategy.

Look at the date shown on this property to get an idea how far back it can go.
Such oldest date is influenced by some factors:
- how long the cash-equivalent instrument has been around (PTSHX is older than SHY, for example);
- how old the Portfolios' instruments are;
- how old the benchmark is;
- how old the various indices used on the Buy and Sell filters are.
Portfolio Boss looks at the earliest date on each of those items, and the earliest date that's the most recent among them (the lowest common denominator) is selected. It then looks at the strategy's rules (technical indicators), and finds which indicator has the most recent start-line; for example between 14-day RSI and 200-day SMA, obviously the SMA indicator-line starts 186 days later (more recent) than the RSI line. And this will be the earliest date for the backtest.
Now, as stated before, instruments (indices) used on filters & rules also affect the earliest date. This can be problematic if they're young, thus cutting short the backtest period even more. You may opt out of them until they become available.

To do that, choose the option “Earliest date, ignoring rule instruments”.

So that any filter containing an instrument (index) won't be used by the strategy until the instrument becomes available in the market. In the example screenshot above, the ROC Index Filter won't be used to exit any Positions until after 23 days since QQQJ was available on the market (where its 23 days ROC can be calculated). This could be useful if you're curious how the strategy performs if the backtest range is extended to the past; though admittedly it's not exactly the same strategy that treads that extended period (but that'd be fine if only one or two filters were deactivated).
You can also set this property to “Set Manually” if you want to set a certain date yourself. On the date field that shows up, you can type a date and press enter on your keyboard. You can type a long or short date format here, either with spaces or dashes.
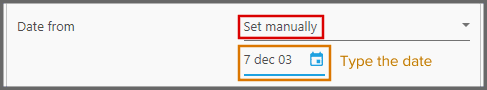
For example, type “7 dec 03” (or dec 7 03) and this field will automatically update to 7-Dec-03.
If you simply want to fine tune one day forward/backward, click this field and press the up/down arrow on your keyboard. Note, this parameter is about trading dates, not calendar dates; thus it automatically skips holidays and weekends.
Or, you can click the little “Calendar” button  to set the date using a Calendar interface.

Note that once you set a manual date, it will be remembered for that strategy, even if you restarted PB (or reverted back to “Earliest date possible”). Just go back to “Set Manually” and it'll be there.
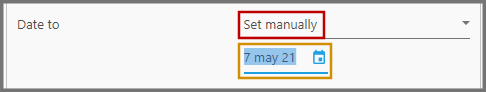
4. “Date To” property: here you can set the end-date of the backtest period. Usually, you want it set to “Latest Date Available”, which means the backtest range ends at your current date (today). But if today is a holiday/weekend, this date is set to the the last time the market opened.

There's a note below, that notifies you how long to wait for the next available price data.
You can also set the date manually by choosing “Set Manually” in this property; which then shows the date field below it. You can set the date either with the “Calendar” button, or type in a date as already explained above.
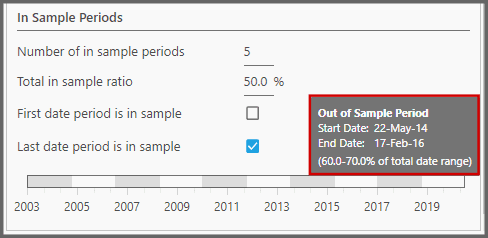
5. The section “In Sample Periods” lets you distribute the strategy's historical price data into In Sample (IS) and Out of Sample (OOS) periods.

“In Sample Period” is a portion of the historical data (from the strategy's Portfolio) used for crafting and fine-tuning the strategy; whereas “Out of Sample Period” is the portion used as a proving ground on how the strategy performs in untested historical data. They're used to compare the strategy's performance in different market conditions; whether or not it stays generally consistent. The key word here is “consistent” performance.
So we're not talking about the strategy's overall performance (for the whole historical data), but rather its performance split into multiple periods (multiple market conditions). We can see whether it performs generally the same for each and every period. If it does, then we are definitely confident it will perform similarly once it's put to real use with real money (that is, the forward performance, as opposed to its “back” test with historical data). We won't get any nasty surprises.
Let's discuss the properties here:
- Number of In Sample Periods – This defines the amount of In Sample Periods to use. The historical price data is then divided into this many In Sample periods, and (usually) as many Out of Sample Periods. For each IS Period, there's an OOS period; the historical data is divided alternately this way. Normally, traders use 1 IS Period and 1 OOS Period (if they use OOS Period at all). But with this property, you can have more than 1 IS Period, with the maximum of 10. Imagine if you use but one period, it's like generalizing the strategy's performance over the long term. The first 4 years it goes up, then the last two years it goes down. It's good to know its overall performance, but it would be even better if it is continually consistent for each short term period it goes through, instead of the total eventual performance. Note: a value of 3 or 5 is generally good here, unless you have a much longer historic price data. You don't want each period to be too short; each In Sample Period must contain at least 1 year's worth of data.
- Total In Sample Ratio – This defines the percentage of the historical data that goes toward the In Sample Period. The rest goes toward the Out of Sample Period. For example you set this to 70, that is 70% for the IS and 30% for the OOS. This 70% of the total historical data is then dispersed equally through the many IS periods you have (set in the previous property). If you use one or two IS Periods, generally you want to set this to 70 or 80 percent. But the more IS Periods you have (5 or more), the smaller each period becomes; so you better use the same percentage for both IS and OOS (set this to 50 percent). The reason being, with a small slice of data for each period, you don't want the OOS to become even smaller by assigning it 20 or 30 percent. That would be too short to accurately gauge the OOS performance. The result would be a lopsided performance where the IS is noticeably lower-performing than the OOS (OOS just needs to weather much shorter market conditions than the IS).
- First Date Period is In Sample – Ticking this checkbox assigns the earliest historical data to be a part of the In Sample Periods. Using the oldest data for crafting the strategy, i.e. for the In Sample, is the norm that most traders use.
- Last Date Period is In Sample – Ticking this checkbox assigns the latest historical data to be part of the In Sample Period. This causes one of the In Sample Periods to be adjacent to the real future (the forward performance). Though this is not the norm, it may yield a better strategy, as its rules are more relevant to the present instead of the old past.
- The Periods bar – This bar shows the visual distribution of the IS and OOS periods throughout the entire historical data, based on the percentage and the number of periods you use. White spans are for the In Sample Periods, and gray for the Out of Sample. You can hover your mouse over a certain span, and a tooltip appears showing the exact date range for that span.
The strategy's equity curve (as shown on the Chart Tab) is also divided into similar white and gray spans:
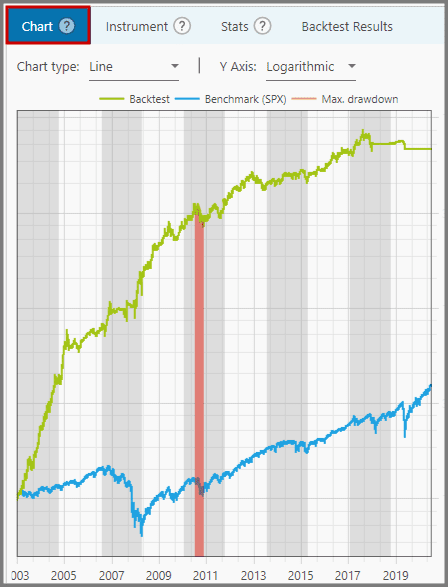
Each span has its own performance, hence its own metrics score. They're then averaged (from the multiple spans) to yield the final metrics score. For example we have five IS Periods (as shown in the screenshot above), with these CAGR each: 20%, 30%, 30%, 25%, and 35%. The strategy's final CAGR (In Sample) is thus 140% divided by 5 is 28%. The final CAGR for Out of Sample is calculated the same way.
Most metrics are calculated with this average. But some, like Max. Drawdown, use the maximum score of all the spans. Others use the summation of all the spans, such as the Total Trades metric.
You want to make sure the metrics performance for both IS and OOS are generally the same; it says a lot about the strategy's consistency. Take a look at the Metrics Tab and compare each metric:
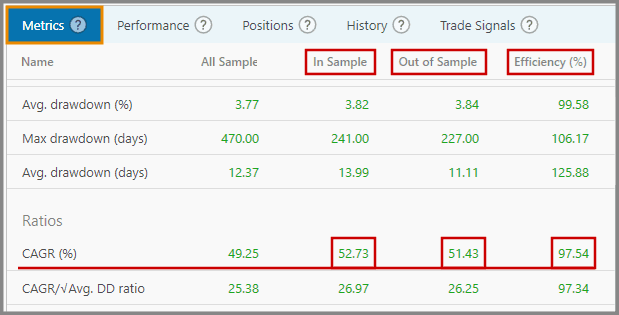
Also look at the Efficiency value. You don't want it too low below 100% or too high; if that's the case, there's disparate performance between IS and OOS, and the strategy is inconsistent. Though it's still tolerable to have Efficiency far above 100%, generally it's advisable to get it as close to 100% as possible. The Efficiency value is calculated from dividing the OOS score by the IS. Note: instead of checking each metric one by one, there's one vital metric to rule them all, i.e. “Score”. This metric combines Drawdowns and CAGR all at once. At the very least, make sure this one metric is generally the same between IS vs OOS.
Note:
You can get hard-core in defining the strategy's OOS period with the “Date to” property. That is, you set it to “Set manually” instead of the “Latest date available”, and then put a date a couple of months (or even years) back from today. That way, the backtest period doesn't cover everything. Once the strategy is created & backtested and you're satisfied with its performance, reveal the rest of the backtest period by setting the “Date to” property to the “Latest date available”. Now do the backtest again to see if its performance stays consistent even today. You'll be surprised: some strategies fare worse, while others perform much better. This is Dan's term of “super out-of-sample”, often used for more rigorous Divine Engine backtests.
You can also use such trick on the “Date from” property (“Set manually” instead of “Earliest date possible”). In essence, some parts of the historical data are hidden even to Portfolio Boss itself.
6. Finally, to backtest your strategy, press the “Start” button at the top-left corner of this page.

A confirmation dialog appears, allowing you to add a memo for this backtest:

If you don't want this dialog to appear each time you start a backtest, tick the checkbox “Don't show again”. Once done, click the button “Continue” to actually start the backtest. A memo is optional, as it's simply a description about a backtest run. Each run (and its memo) will be seen under the Manual Results Tab:

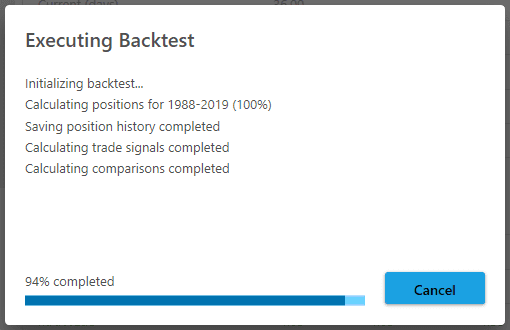
Now an “Executing Backtest” dialog shows up to show the backtest progress:
Sometimes, the latest price data (on the portfolio) have not been downloaded yet, so you must wait (PB will pop up a dialogue saying such thing). But you can choose to run the backtest anyway with the available data, though the backtest may not be accurate.
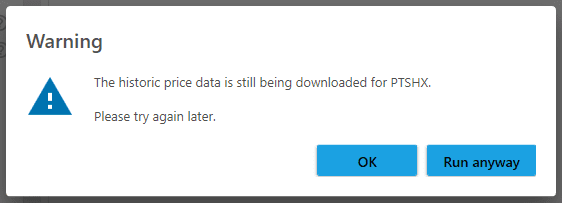
In some cases, the price data is almost entirely not downloaded yet, for example when you just installed Portfolio Boss. In such case, you can't run the backtest until most of the data are downloaded. Sometimes price data couldn't be downloaded because there are troubles with the CSI download & processing service; you can check the Portfolio Boss Status Page if such is the case:

Important:
- You can replicate previous trading signals (shown on the “Trade Signals” Tab) by assigning the “Date To” parameter at one day prior to the strategy's switch-day. For example, the strategy's switch-day is the 2nd trading day of the month.

Assuming that day is not a holiday or a weekend, then set the “Date To” parameter at the 1st trading day. If it's a holiday/weekend, look at the next market open, and set the date one day prior to that.

In essence, the “Date To” parameter acts as if you're currently on that date.

For trading signals other than the switch-day, you can set the “Date To” parameter at one day prior to the Buy/Sell actions (arrows) as shown on the instrument's price chart (Instrument Tab).

- Backtesting does not necessarily mean you're comparing against the benchmark. Doing a backtest yields statistical results that you may use to compare against another backtested strategy. This is because inherently, a benchmark is just an index, not a strategy.
- Don't forget to re-run the backtest once you have modified the strategy's rules, so you can look at the new stats. It's perfectly okay to run the backtest many times.
Discount Applied Successfully!
Your savings have been added to the cart.
Report
Block Member?
Please confirm you want to block this member.
You will no longer be able to:
- See blocked member's posts
- Mention this member in posts
- Invite this member to groups
- Message this member
- Add this member as a connection
Please note: This action will also remove this member from your connections and send a report to the site admin. Please allow a few minutes for this process to complete.
Report
