Surprise Day Filter
Surprise, surprise! There's a gap!
This filter identifies a “breakaway gap” in the instrument's candlestick chart. The day that the gap happens is the “Surprise Day”. Its criteria are as follows:
- The opening price is higher than the previous day's closing price, thus an upward momentum.
- The closing price is higher than its opening price, therefore it must be a green candlestick.
- Its volume (of shares) is more than twice the average volume of 1 month.
- The distance between its closing price and the previous day's closing price is more than 2 times the average volatility of 1 month. This ensures there's indeed a big gap from the previous day's candle.
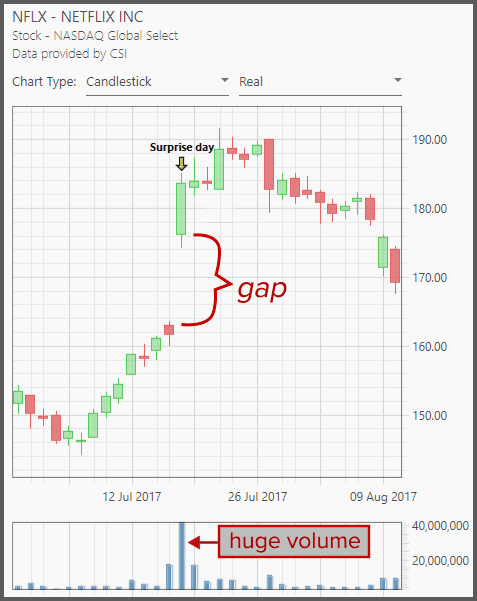
Such an upside “breakaway gap” with heavy volume indicates a strong bullish momentum. But keep in mind that most gaps are eventually “filled”. That is, subsequent prices (after a few days or weeks) may drop to close that gap (or at least to approach that gap). The crowd psychology during the gap is one of hysteria; everybody wants to jump on the bandwagon. But eventually common sense prevails and the price corrects itself.
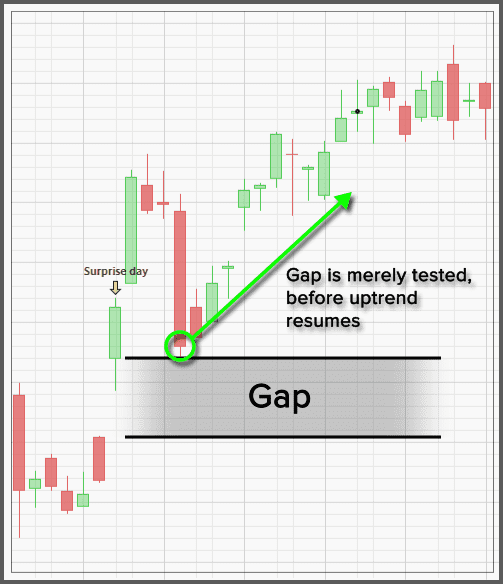
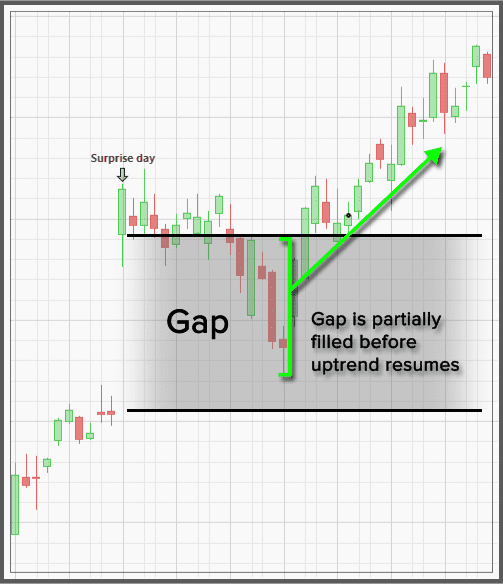
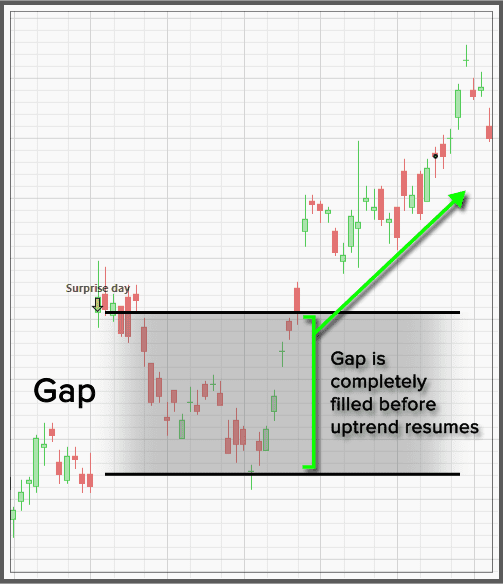
Before you jump in to buy, it's better to wait a certain period so you won't get whipsawed by the temporary downdraft that happened after the gap.
The way this filter is constructed, it does not identify “common gaps” (small gaps with small volume) which are technically insignificant. So with this filter, you're more likely to jump into a strong uptrend.
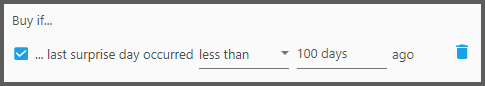
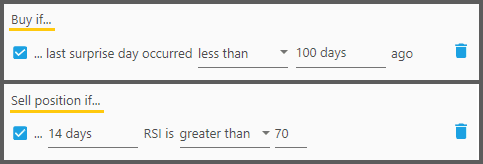
1. The first parameter defines whether the Buy/Sell signal should be given in “Less Than” the threshold waiting period, or “More Than” that period.
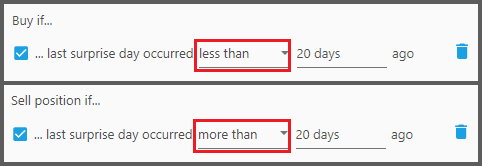
For example, as in the screenshot above, “Less Than 20 days” means the signal could be given within 20 days after the Surprise Day happened. It could be 1 day after the Surprise Day, or 3 days, 19 days, etc. “More Than 20 days” means you'll wait 20 days minimum before the signal is given, so it could be 21, 25, or 50 days (after the Surprise Day) before the signal is given.
Generally, “Less Than” is good for a Buy Filter, while “More Than” is good for a Sell Filter.
2. The second parameter defines the threshold waiting period.
For a Buy Filter, it's best to set this to a longer period, let's say 100 days (or longer). Thus combined with the parameter “Less Than” (as explained previously), the Buy Filter will give the signal in “Less Than 100 days” after the Surprise Day occurred.
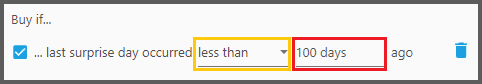
The idea is this: we don't know how long a gap would be filled (or tested). So with a wider window, that is, within 100 days after the gap (it could be 1 day, 50 days, 70 days, etc) we're giving a bigger leeway for the price to complete the retracement (to test the gap). We patiently wait before we jump in. Otherwise we may get caught in the temporary downtrend, if we use a shorter period.
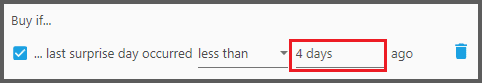
Thus it follows that a Buy Filter could also be set to “More Than”, paired with a short period, let's say “9 days”:
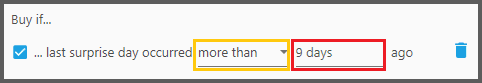
But this could mean we're waiting too long. Because “More Than 9 Days” is either 11 days, 50 days, or 300 days and more! If it's too long, we're jumping in when the bull trend is already exhausted. So it's still best to use the previous form (“Less Than 100 Days”) for a Buy Filter.
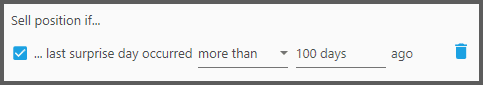
Now if you use this as a Sell Filter, it's best to set “More Than”, paired with a longer period. For example 70 days or longer:
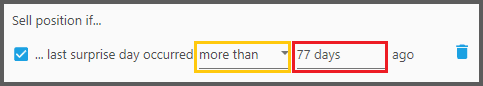
There are two reasons for this form of the Sell Filter:
- With such a long period (after the Surprise Day happened), the uptrend is more likely exhausted. So we sell.
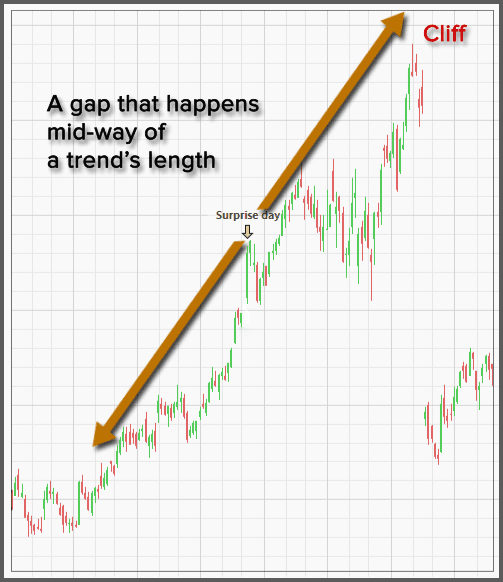
- Some chartists believe in the idea of a “Measuring Gap”. That is a gap that happens halfway of an uptrend's length. So by waiting a certain period after the Surprise Day, we can “measure” where the cliff would be.
Breakaway-gaps are extraordinary events. But their role should not be overemphasized. Sometimes it's a good idea to use other filters, to confirm that such a gap occurs at a young bull market instead of an old, exhausted one.
A breakaway gap that happens after a trading-range gives a strong confirmation that a new bull market has emerged, with tremendous upside momentum. But such an event may be rare, and a strategy based on it would stay in cash most of the time, yielding underwhelming performance.
Still we can get the next best thing: at least we make sure the Surprise Day does not happen at an exhausted uptrend. For example, instead of using RSI Buy Filter to signify a young bull trend (buy if RSI is less than 40, and there's a Surprise Day recently), we put the RSI as a Sell Filter to signify an exhausted bull trend (do not enter a position if RSI is greater than 70). Remember that an instrument that triggered a Sell Filter in the same time it fulfilled the Buy Filter, won't be entered as a Position.
Notes:
- The way this filter is constructed, there's no way it could identify multiple-gaps pattern (multiple gaps could signify exhaustion, or the island reversal pattern, etc). In fact, this filter can't be applied more than once (for each Buy or Sell Filters Panel).
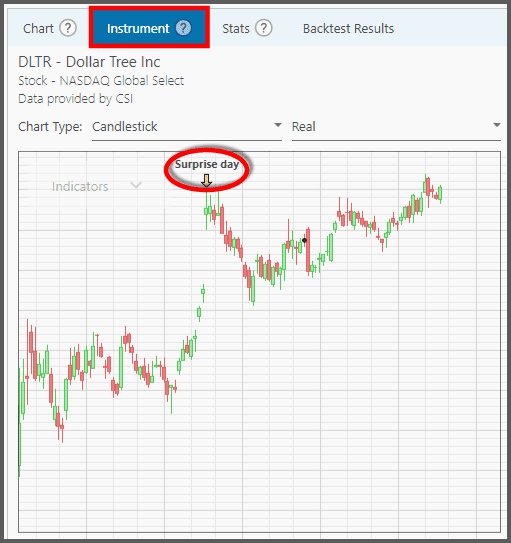
- If you look at the Instrument Tab, there's an arrow above the candlestick signifying a “Surprise Day”. That's when the gap happens.
Discount Applied Successfully!
Your savings have been added to the cart.
Report
Block Member?
Please confirm you want to block this member.
You will no longer be able to:
- See blocked member's posts
- Mention this member in posts
- Invite this member to groups
- Message this member
- Add this member as a connection
Please note: This action will also remove this member from your connections and send a report to the site admin. Please allow a few minutes for this process to complete.
Report
