Backtest Strategy Page Overview
The “Backtest Strategy” page is the heart of Portfolio Boss.
To access this page, click on the “Backtest Strategy” button  at the left of the interface (provided you have selected a strategy from the “Strategy Management” page).
Or, you can double click a strategy so you're taken immediately to this page:

In this page you can define the gears, nuts, and bolts of a strategy:
- at what date the strategy trades each month,
- what's the Cash Equivalent when Positions are liquidated,
- how many Positions to hold at any given time,
- how to define the Limit Orders,
- whether you'll be trading Long or Short Positions,
- what Portfolio(s) the strategy will trade,
- what Technical Indicators to use for entering and exiting Positions,
- whether it uses the AI-based “Divine Engine” for creating the ultimate strategy,
- and many more!
In short, you can create an extremely complex (and automated!) trading strategy without the slightest experience in computer programming.
Once you define the strategy's rules, you will then backtest the strategy with this page as well. You'll see how it performs in decades of historic market conditions. You can also define the in-sample and out-of-sample data to see how the strategy performs in untested waters (or the future).

Aside from these things, this page allows you to automatically calculate the number of shares to be bought (based on each Position's weight and your account size), and export the Orders' details that you'll enter to your broker.
Note if you're using a restricted license, many of the parameters in this “Backtest Strategy” page will not be available. Please contact our Customer Support at support@portfolioboss.com if you wish to upgrade your license.

This page is divided into two Areas, each containing its own Panels or Tabs:
- The Rules Area is where you define the strategy's rules, filters (technical indicators), and portfolios; in short, its mechanism.
- The Reports Area shows the strategy's performance in various statistical data. You want to be as scientifically accurate as possible before committing your hard earned money to that strategy. Here you can visualize the data in various charts and graphical Indicators. As well, you can receive trading signals from this area.
Before we delve further, you must understand the terminology we're using in this page:
- Area: As explained above. A region with its own collection of Panels or Tabs.
- Panel: A block that contains its own functions, usually studded with rules, filters, or properties. Panels exist on the Rules Area.
- Group: A collection of Tabs grouped together. Groups exist on the Reports Area.
- Tab: Similar to a Panel, it's a block with its own function, usually a report. Tabs exist in the Reports Area.
- Section: A portion of a Panel (or Tab) that envelopes some properties/reports, which work toward a specific function.
- Filter: A single string of criteria, in the form of a technical indicator used as a Buy or Sell mechanism.
- Rule: Similar to a filter, it's a string of command that defines a certain behavior. Rules exist in the System Settings and Ranking panels.
- Property: Similar to a rule, but it exists in the Backtest or Backtest Parameterization panels. Sometimes “rule” or “filter”, and “property” are used interchangeably.
- Parameter: A component of a filter/rule/property where usually you can input a value. It's also known as a “field”.
- Value: The content(s) of a parameter, usually input by you. Built-in values are known as “options” (as opposed to values you typed).
The layout on this page is customizable to suit your visual needs (and screen space).
You can expand the Rules Area to the right, so the Panels there are distributed horizontally too. This allows you to have a holistic view of the strategy's rules, without much scrolling. Simply hover your mouse at the edge between the Rules Area and the Reports Area. Once the cursor changes into an arrow, drag it to the right as much as you will. The Reports Area will give up space for this expansion.
You can also customize the Reports Area by moving its Tabs around, and docking it somewhere else (but still within this Reports Area). Simply drag the Tab's header (the Tab's name), and move it toward one of the landing spots (the blue highlighted area):
There are three types of landing spots:
First is located at the Group's top (that shows the Tabs' names). If you drag the Tab here, you will make it a part of that Group, in relation to the other Tabs there. For example you want this Tab to be dropped in between the Tabs there; simply release the drag between the other tabs. Note, if you simply want to rearrange Tabs within the same Group, just drag each Tab header toward another header within that same Group; this doesn't show a blue highlighted landing spot.
The second type of landing spot is located at the four extreme edges of the Reports Area–top, bottom, right, left. There's an indicator at each of the edge, looks like this:  . When a Tab is dragged toward that indicator, a landing spot is highlighted in blue, indicating the Tab will be placed there on its own. In other words, it is placed at the top, left, bottom, or right edge of the Reports Area standing on its own (displacing other Tabs/Groups to give space).
The third type of landing spot is that cross-shaped indicator: 
It appears when you drag a Tab and hover it to a Group. Drag the Tab to one of the arrows–the top, bottom, left, or right arrow in that cross indicator–and a blue landing area is displayed, dividing that Group in two. So if you release the drag at the top arrow, for example, the Tab will be placed at the top half of the Group, standing on its own, i.e. dividing the previous Group in two parts. Now, there's also the middle indicator inside that cross: if you release at the center of the cross, you're placing the Tab as part of this Group, instead of standing on its own. The Tab is put leftmost, side by side with other tabs on that Group.
As a side note, when a Tab is being dragged, its prior place will vanish. It does not actually vanish until you release the mouse at one of the landing spots. If you release it without the landing spot showing, the docking is cancelled and that Tab reverts to its previous location.
Notes:
- You can resize any Group/Tab by dragging its edges: hover your cursor over an edge and see that it changes into an arrow cursor, then drag it.
- Any changes you made to the strategy (through this “Backtest Strategy” page) will be immediately saved. Even after you close Portfolio Boss and restart your computer, these changes are kept. If you want to reset a strategy to its default state (provided it's one of the Licensed Strategies), you can press the “Back” button (at the top-right corner of the interface). That button brings you back to a previous page you have visited, in our case the “Strategy Management” page.

Then, on that page, press the “Reset” button  to revert the strategy to its default state.
- You can right click any of the scrollbars (throughout PB), and a context menu appears. “Scroll Here” lets you scroll the content to to the location you right clicked at. “Top” scrolls to the top of the content; while “Bottom” to the bottom. “Page Up” reveals a part of the content upward starting from where it was hidden, while “Page Down” reveals the content downward. “Scroll Up” scrolls upward by a little increment, while “Scroll Down” scrolls downward a little step.
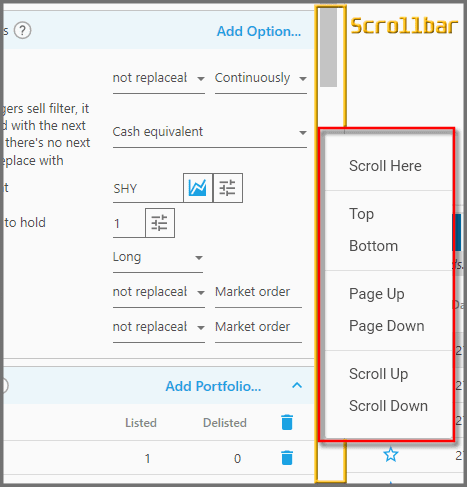
Horizontal scrollbars have different options' name, but the idea is similar.
Discount Applied Successfully!
Your savings have been added to the cart.
Report
Block Member?
Please confirm you want to block this member.
You will no longer be able to:
- See blocked member's posts
- Mention this member in posts
- Invite this member to groups
- Message this member
- Add this member as a connection
Please note: This action will also remove this member from your connections and send a report to the site admin. Please allow a few minutes for this process to complete.
Report
