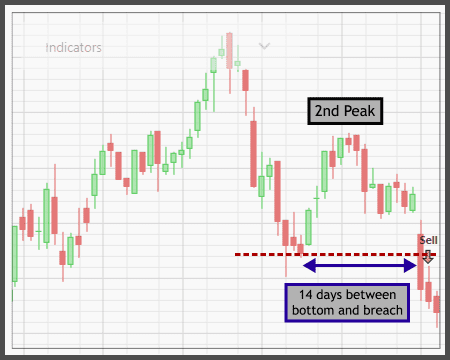
Average True Range (ATR) Filter
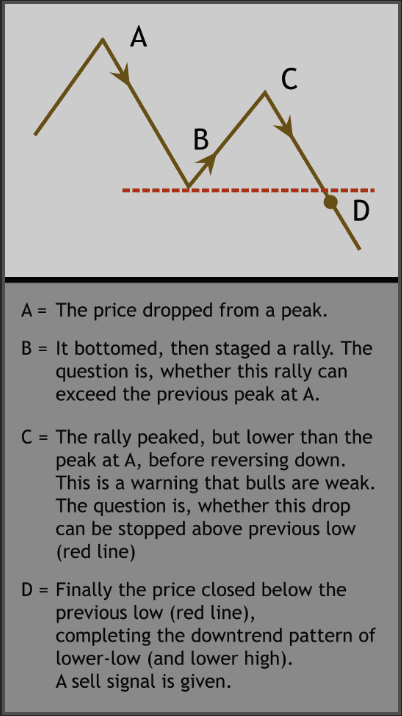
This filter looks for downtrending instruments based on a subset of Dow Theory that states a downtrend happens when there are lower lows and lower highs.
In general terms, this filter looks for a price drop, and then a rebound which peaked lower than the previous high, and finally a breach of the previous low, thus completing the lower-low and lower-high pattern in a downtrend. In short, this filter is best used a sell filter–or better yet, as a short filter. Although you can add this as a buy filter, the downtrend pattern recognition doesn't make sense to be used as a buy filter.
This filter allows you to define how large of a drop and subsequent rally by utilizing the instrument's Average True Range (ATR). ATR is a price volatility reading, that tells you how much the price usually moves per day, during a specified period. You can also define how long such a downtrend pattern should complete, by customizing the period parameters on this filter, to conform with your trading duration.
Now let's get to the parameters:
1. The first parameter defines the period for calculating the ATR.
This ATR, in turn, will be used to define the size of the price drop and subsequently rally (as illustrated by point A and B on the previous diagram). A common ATR period is 14 days, but we found the default of 20 days to be good overall. Obviously you can set this shorter or longer depending on your trading duration. Make sure though, that this ATR period doesn't stray too far from the period parameters explained next–for defining how long the pattern should complete. If you set this ATR period too high or too low, the pattern may not actually be representative of a downtrend, thus giving false signals.
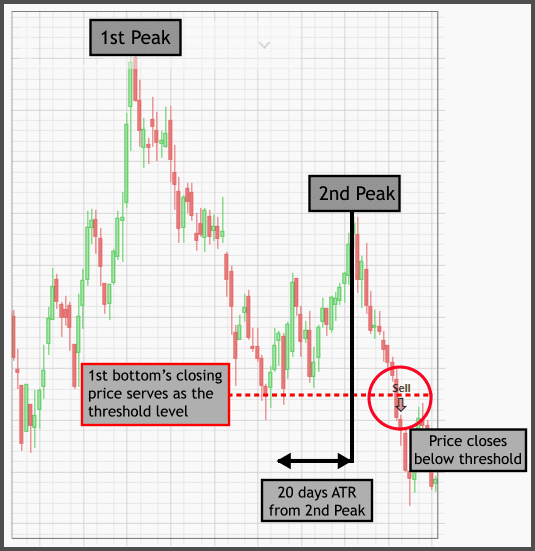
As a little technicality, this ATR period is calculated not from the latest date–i.e today, but from the second peak. For example, an ATR period of 20 days means the ATR is calculated from that peak all the way to 20 days ago from there. Thus it tells you how many dollars the price usually moves per day, during that 20 days period.
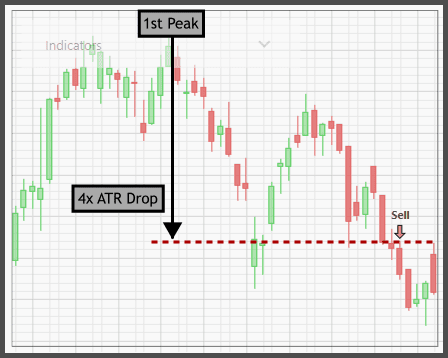
2. The second parameter defines the size of the first drop.
For example, a value of 4 here means the first drop is 4 times the ATR. So, if the ATR is 2 dollars, the drop would be 8 dollars. Keep in mind that the drop does not necessarily happen in a single day; it could span many days to reach that bottom. Also, the first drop does not necessarily happen from a perfect peak; it could've been calculated from the middle of a drop.
The default value for this parameter is 4. If you set this at a very high value, you're essentially waiting too long for that drop to happen, thus the downtrend may already be exhausted–in case of short selling–or your long position has suffered too much losses before the sell signal is given. Besides, it's rare for instruments to drop so much, so sell signal may not be given at all. Note, this bottom is the closing price of the lowest candle.
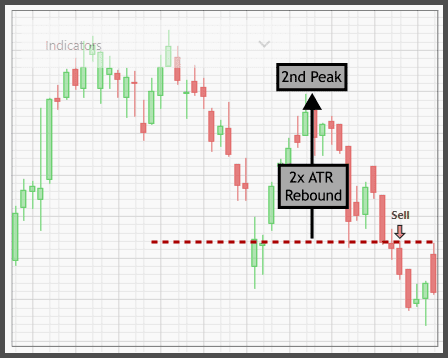
3. The third parameter defines the size of the rebound after the previous drop.
So after the price dropped toward that bottom specified previously, it rallied toward a peak whose height is defined in this parameter. Generally, you want to set this parameter at a lower value than the previous parameter, thus essentially you're finding a “lower-high”, i.e a peak lower than the previous peak. You can set this at either half the previous parameter, a third, or two-third, because they're the usual heights for a downtrending lower-peak. For example, with a value of 2 here–which is the default value–the price rebounds 2 ATR after that bottom. If the ATR is 2 dollars, that means a rally of 4 dollars from the previous bottom price.
4. The fourth and fifth parameters define how long it takes for the price to rally–from the previous bottom–and then drop again breaching that bottom.
For example, you set them to 10 and 15 days, which means it will take anywhere from 10 to 15 days–it could be 10, 11, 12, 13, 14, or 15 days–for the price to leave that previous bottom, peaking, and finally breaching the previous bottom level. In other words, the duration for the mountain pattern, from bottom, peak, to bottom again. Once the price closes below that bottom, a sell signal will be given, because the lower-low and lower-high pattern has been completed, signalling a downtrend.
Note, you can set these two parameters at the same exact value, which means the duration for the mountain pattern will be exact. Let's say you set them both to 10 days, then it will be exactly 10 days from the bottom, peak, and bottom again. For that reason, it's better to set these two parameters as a “window”, instead of an exact value, because different instruments may complete the pattern at different periods.
Set these two values based on your trading duration, i.e lower value for shorter duration, and higher value for longer duration. Beware if you set this too short, you may only get noise and false signals, and stopped out all the time, where the instrument may not actually be in a downtrend. The maximum you can set here is 30 days.
Notes:
- The tool-tip description says liquidated positions go to cash-equivalent. This is not always the case, depending on whether you use cash or cash-equivalent for the strategy. This filter works just as any normal filters.
- The drop and rebound do not necessarily happen at exactly the values you set (for example 4 and 2 ATRs respectively), but could be a little off from that. As long as the bottom and peak's candles capture the specified ATR height (within their high and low of the day), then it's fine.
- The duration for the whole pattern to complete is usually 150% of the last parameter. For example, if the last parameter is set to 20 days, then the whole thing from the first peak, drop, rally, to breach takes about 30 days. In other words, each drop or rally takes about one half of that period parameter–or 33% of the whole thing.
Report
Block Member?
Please confirm you want to block this member.
You will no longer be able to:
- See blocked member's posts
- Mention this member in posts
- Invite this member to groups
- Message this member
- Add this member as a connection
Please note: This action will also remove this member from your connections and send a report to the site admin. Please allow a few minutes for this process to complete.


