Rate of Change (ROC) Filter


This filter looks at the price change of an instrument from the beginning of the period until today. Such price change is represented as a percentage.
For example, with a period of 25 days: an instrument's closing price today is $30, while 25 days ago (the beginning of the period) it was $25. That translates into a price increase of $5, or 20% increase from the beginning price ($25).
If the price is decreasing, we will have a negative percentage. For example, the price went down from $20 to $10, which means a decrease of $10, or -50% of the beginning price ($20).
In other words, this filter looks at the instrument's price momentum or velocity (its “Rate of Change”, how fast the price is gaining or losing).
- Positive percentage values may indicate an uptrend. The higher the positive percentage, the stronger the uptrend.
- Negative percentage values may indicate a downtrend. The lower the negative percentage, the stronger the downtrend.
- Percentage values near 0% may indicate a trading range.
Note that you can apply this filter multiple times as Buy Filters, to look for discounts:

- The first Buy Filter looks at decreasing price in a short period, let's say 5 days.
- The second Buy Filter makes sure that such price dip happens in a generally upward trend, thus it looks at increasing price for a longer period, let's say 200 days.
This filter is also great as a stop-loss, to lock your profit from excessive downward movements (for example during bear markets). In such case, you may want to set the strategy to revert to Cash after positions are sold (instead of a Cash Equivalent, because Bonds can also drop deep during financial crisis).

Do understand, some manual traders use the RoC as a momentum oscillator. But such use is very subjective for each instrument. There's no definite overbought/oversold zones: some instruments are known for their huge advances and declines, while others are calmer. Therefore it's best to use this in tandem with a more general momentum oscillator such as the RSI.
1. The first parameter defines the period to look for the starting and latest price. For example, a period of 10 days means the price 10 days ago is compared to today's price.

Adjust this period according to your trading duration. If you're a short term trader, generally you will use values like 5, 9, or 12 days. Intermediate timeframe is best represented by a period of 45 days. If you're a longer term trader, use longer periods such as 200 days. And don't make it too short or too long, in relation to your trading time-frame. If it's too short, you'll get many false signals. Longer periods generally give a truer and more predictable future performance, but it may be too late to enter the Position (the trend may well be underway toward its end).
It's best to have multiple instances of this filter, with differing time periods.
2. The second parameter defines whether the instrument's percentage-change must be “Above” or “Below” the threshold percentage-change. Generally, use “Above” to find uptrending instruments, and “Below” for downtrending ones.

3. The third parameter defines the threshold percentage-change, whose meaning is already explained above.

A negative percentage bottoms out at -100%, because that means the instrument price has become $0, the lowest price possible for an instrument. A positive percentage on the other hand, can go 100% and beyond, as there is no limit to the upper price of an instrument.
Notes:
- You may use a very short period, like 2 days, along with a big percentage change (e.g. beyond 50%, positive or negative) to find potential “gappers”. That is, the price change on mere two days was so great that the two candles may form a gap between them. This, in turn, can be used on any interpretation: either that gaps may get filled sooner or later, or, such huge momentum indicates a changing trend or breakout (or a strong confirmation).
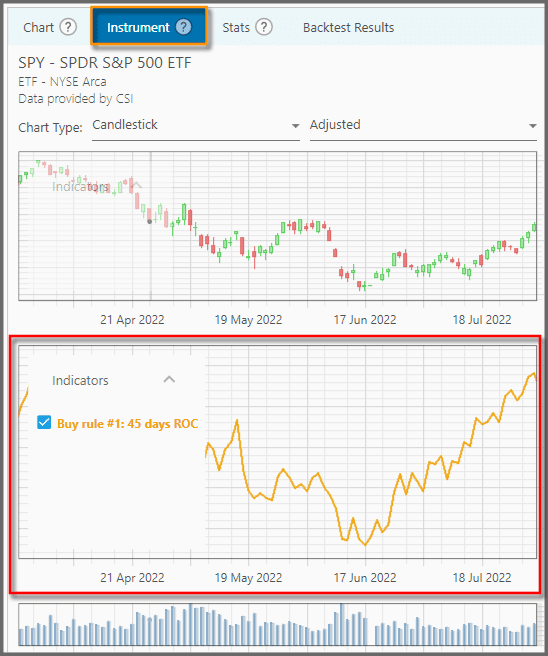
- Once this filter is applied (and the strategy is backtested), you can see the ROC indicator below the price chart (at the Instrument Tab). Make sure you have selected an instrument before you can see this ROC indicator.

Report
Block Member?
Please confirm you want to block this member.
You will no longer be able to:
- See blocked member's posts
- Mention this member in posts
- Invite this member to groups
- Message this member
- Add this member as a connection
Please note: This action will also remove this member from your connections and send a report to the site admin. Please allow a few minutes for this process to complete.
