Stochastic Oscillator Filter
The Stochastic Oscillator Filter is a momentum oscillator that attempts to predict turning points in the instruments' price, or to identify a trend's strength. It functions similarly as RSI; and its value oscillates between 0 and 100. It was developed by George Lane in the late 1950's.
This oscillator is calculated by first identifying the highest and lowest price in a given period. The latest closing price is then expressed as a point within such highest & lowest range; this is the Stochastic's value. A value of about 0 indicates the closing price falls near the bottom of the range, and a value close to 1 indicates it falls near the top of the range. In PB, such highest and lowest prices come from the literal highest & lowest wicks that the daily candles have.
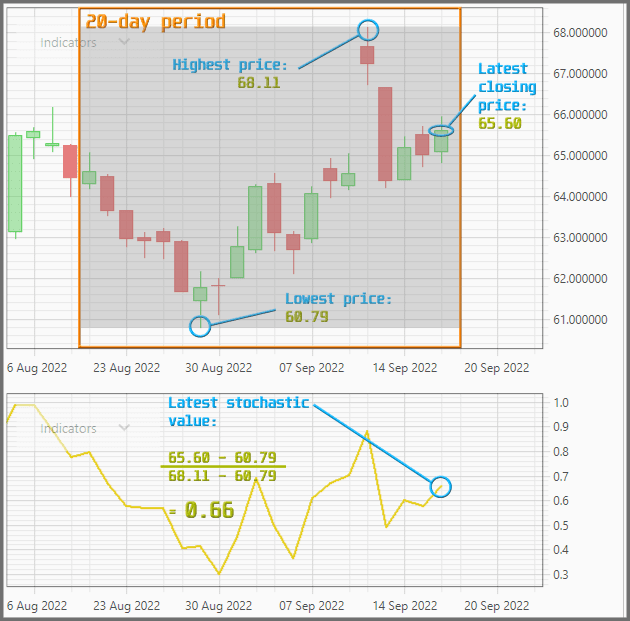
As shown in the example above, the latest Stochastic value is calculated by: finding the difference between the latest closing price and the lowest price of the period, and this is divided by the difference between the highest and lowest prices of the period. The resulting value is often referred to as %K.
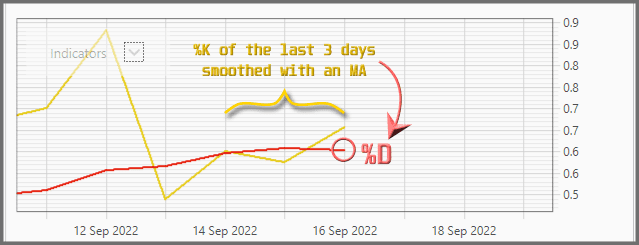
There's a second indicator line, referred to as %D, calculated by smoothing the %K with a Moving Average (usually SMA or EMA, of the last 3 days). Both %K and %D are shown below the price chart on the Instrument Tab.
There are various interpretations of the Stochastic indicator. One interpretation calls for the %K (or %D) to cross above/below the overbought or oversold area (usually a value of 0.8 and 0.2, respectively), before a signal is given. Another interpretation looks at the %K and %D crossing above/below each other. And then there are those that combine both, as an advanced form of RSI: Buy when %K goes in the oversold, accompanied by a crossing above the %D; and sell when it goes in the overbought, accompanied by a crossing below the %D. Still there is another interpretation that looks at divergences between the price action and the %K movement: whether the price creates lower lows while %K creates higher lows (bullish), or the price creates higher highs while %K goes lower highs (bearish). Though this divergence method isn't modelled in PB.
Essentially, the main idea is this: The momentum a.k.a. speed of the price (as represented by Stochastic) changes before the price itself changes. Therefore if the momentum is strong: you see the %K (or %D) goes near the extreme (1 or 0) for an extended period. It's best to just follow such a strong trend instead of anticipating its turning point.
Let us now discuss this filter's parameters, starting from the easiest to understand:
1. %K Period: This defines the period for calculating the %K.
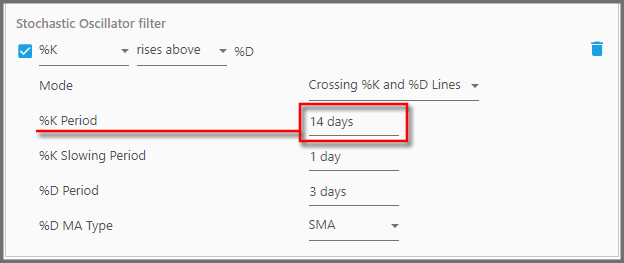
In other words, the filter will identify the highest price and the lowest price within such period, and then the latest closing price falls within such high-low range. Obviously it's a moving period. The typical value here is either 5, 9, or 14 days.
2. %K Slowing Period: This parameter modifies the %K into either a Slow Stochastic or a Fast Stochastic.
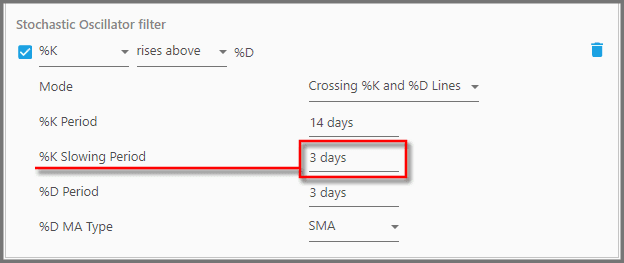
With a value of 1, the %K is calculated the usual way, no slowing. It's what people call the Fast Stochastic. But some technicians swear that it generates less reliable signals, resulting in whipsaws. So they decided to slow it down (usually) by a value of 3 days here; this is the Slow Stochastic, which is smoother than its sibling. So when it's set higher than 1, %K is calculated by averaging the highest-high and the lowest-low over the number of this period before performing the division. The maximum period here is 10 days.
3. %D Period: This defines the Moving Average period for smoothing the %K, which results in %D line.
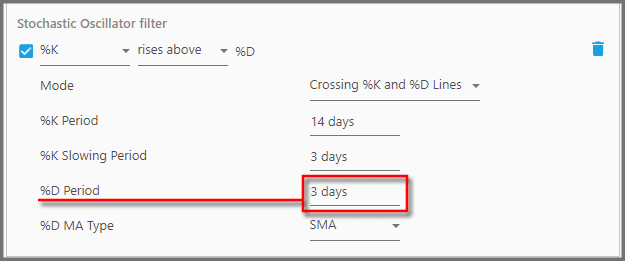
So whatever values spit out as %K (either slowed or not), will be smoothed out to yield the %D. Most technicians use a period of 3 days here, which means the %K value of the last 3 days are averaged.
4. %D MA Type: This defines the type of Moving Average to produce the %D.
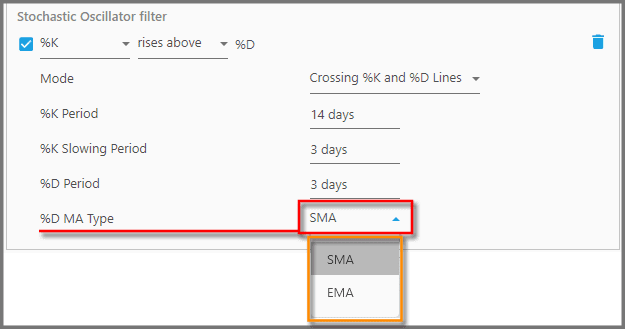
Here you can choose either SMA (Simple Moving Average) or EMA (Exponential Moving Average). So the %K of the past certain days will be smoothed by either SMA or EMA to produce the %D. You can't go wrong with one or the other, the difference is miniscule. Though the general wisdom says for a volatile portfolio (like small-cap stocks or the Nasdaq 100), you're better off using EMA, as it puts more weight on the latest %K values.
5. Mode: This should be the first parameter you set when you use this filter. It defines the method (interpretation) for using the Stochastic indicator.
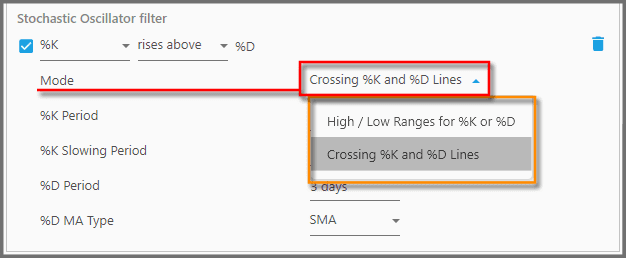
Changing the mode reveals or hides certain parameters. There are two modes in the PB version of the Stochastic:
- High/Low Ranges for %K or %D
- Crossing %K and %D Lines
The former utilizes overbought & oversold (or any threshold) values for either %K or %D. The latter identifies crosses/intersections between %K and %D; whether one goes below the other. You can combine both modes by applying the filter multiple times (especially as Buy Filters), each with a different mode and parameters than the other.
We'll explore each mode in the following sections, along with the best parameters' values for them.
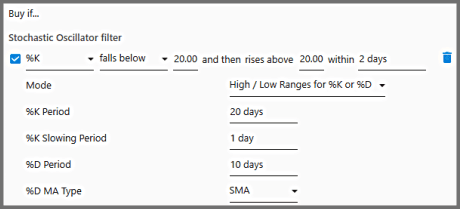
6. Mode – High/Low Ranges for %K or %D: This mode lets you use Stochastic with the overbought/oversold areas (or any threshold value).
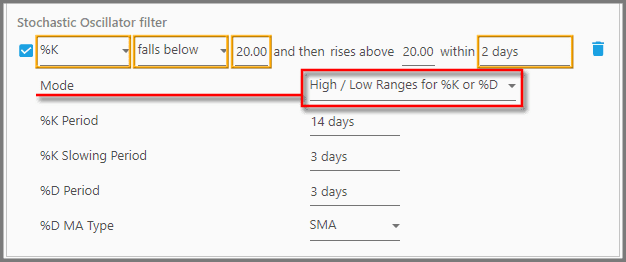
It's an advanced version of the RSI: that the %K (or %D) must punch through the overbought/oversold line, and then falls back through the same line within a specified period. As shown in the screenshot above, this mode has four parameters specific to it (orange box highlighted). From left to right:
- The 1st parameter defines whether it's the %K or %D that will cross the threshold value.
- The 2nd parameter defines whether it (%K or %D) rises above and then falls below the threshold value, or vice versa: it falls below and then rises above the threshold.
- The 3rd parameters: See there are two parameters set to 20.00 in the screenshot above; if you set one parameter, the other is automatically set with the same value. These define the threshold value. Overbought is usually around 80, while oversold is around 20 (you can set this anywhere from 0 to 100).
- The 4th parameter defines the period in which the %K (or %D) must cross-back the threshold value. That means, the first time it punched through the threshold does not necessarily happen within such a period.
General wisdom says if the indicator goes above the overbought and shortly after falls below it, it's bearish. And if it goes below the oversold and then rises above it, it's bullish. Our tests indicate that for a Buy Filter, it's generally good to use %K (instead of %D), which should fall below then rise above a threshold value of 60 to 90, within 140 to 150 days. As for the Sell Filter, apparently it's best to use %D that rises above then falls below a threshold of 40 to 60, within 130 to 170 days.
But again, this is just a rough rule of thumb whenever this Stochastic is used simultaneously as a Buy and a Sell Filter. You must find better values if your strategy contains additional rules & filters.
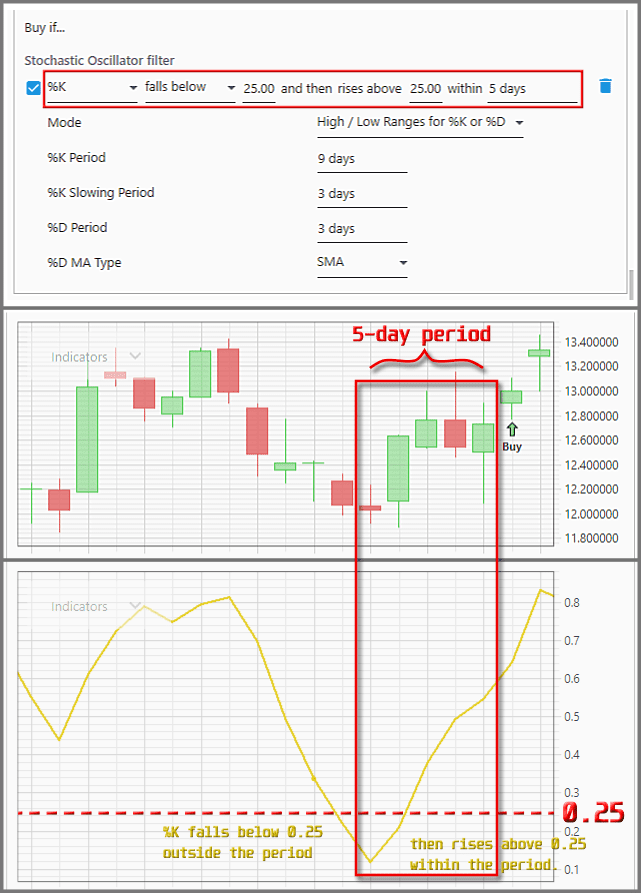
As a side note, if you want to use Stochastic the way RSI is used, that is, the indicator simply goes in the overbought or oversold zone without falling back, you can set it so the indicator line have its first cross from the outside, that is from beyond the overbought/oversold zone:
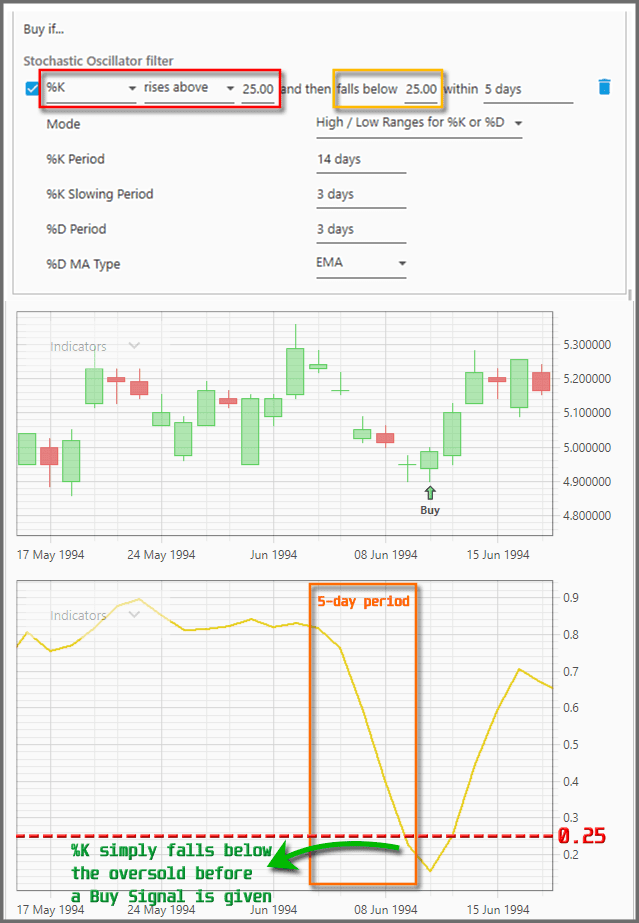
In the example above, you set the first three parameters (as bounded by the red rectangle) so that the %K rises above the oversold of 0.25. That implies that %K attacks from below the oversold (at any time in the past, not necessarily within the set period). Then, within the set period it must fallback below the oversold, which is the actual trigger for the Buy Signal.
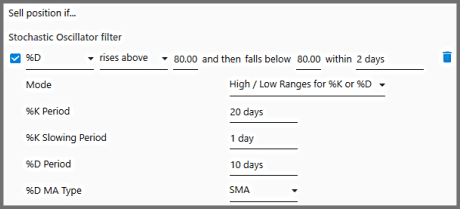
7. Mode – Crossing %K and %D Lines: This mode generates trading signals from the crossovers between %K and %D. So this does not utilize overbought & oversold areas.
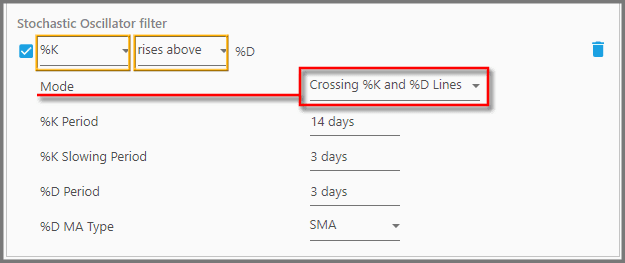
It's similar as in MACD where signals are given when the MACD line crosses above/below the Signal line, but here you can choose what indicator to cross which line. As shown in the screenshot above, there are two parameters specific to this mode (contained in the orange boxes). From left to right:
- The first parameter lets you choose the indicator line that actively crosses above/below. If you choose %K, it will cross above/below %D to generate the signals. If you choose %D, it will cross above/below %K for the signals.
- The second parameter defines whether the active line must “rise above”, or “fall below”, the other line, for the signals to be generated.
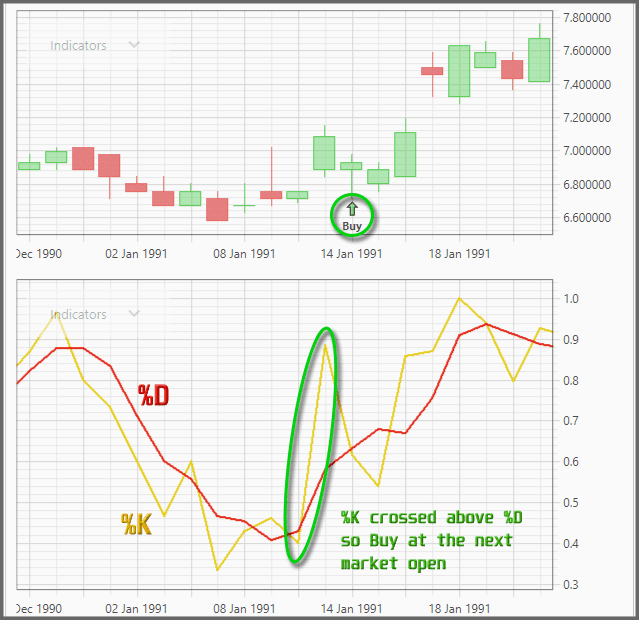
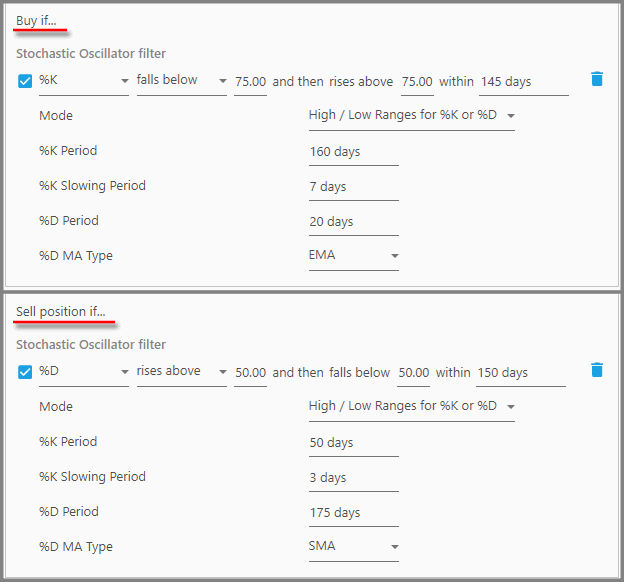
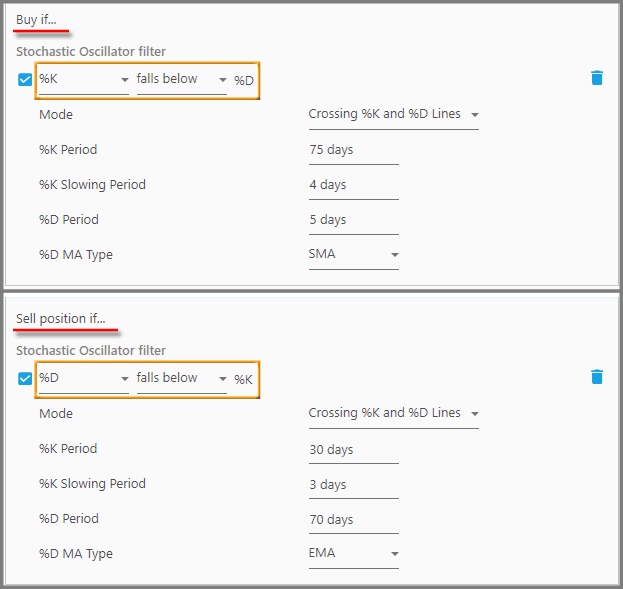
The general wisdom says it's bullish if %K crosses above %D, and bearish if %K crosses below %D. Our tests showed that it's good to buy if %K falls below %D, and sell if %D falls below the %K. Though once again, this depends on your other rules, filters, parameter values, and portfolio. We used the Stochastic simultaneously as a Buy and Sell Filter:
Note:
You can combine both modes, so that the indicator line must do two types of crossing before a signal is given: it must cross the overbought/oversold, and, it must also cross the %D (or %K) as a confirmation. Simply apply two Stochastic Buy Filters, one set to use the mode “High/Low Ranges…” and the other set to “Crossing %K and %D…” :
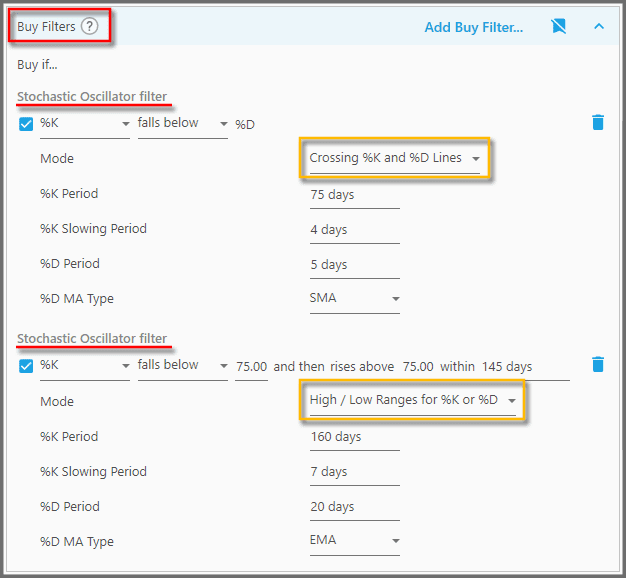
Since the criteria are constricted even more, this may reduce drawdown and improve the consistency of your strategy. You can't use this trick as Sell Filters, because they don't combine the criteria for exiting positions. If just one criteria is triggered, the position is sold at the next market open.
Discount Applied Successfully!
Your savings have been added to the cart.
Report
Block Member?
Please confirm you want to block this member.
You will no longer be able to:
- See blocked member's posts
- Mention this member in posts
- Invite this member to groups
- Message this member
- Add this member as a connection
Please note: This action will also remove this member from your connections and send a report to the site admin. Please allow a few minutes for this process to complete.
Report
