Simple Moving Average (SMA) Position Filter
This filter calculates an instrument's Simple Moving Average, and then looks whether the last closing-price is above or below that SMA, to decide whether the instrument will be bought or sold.
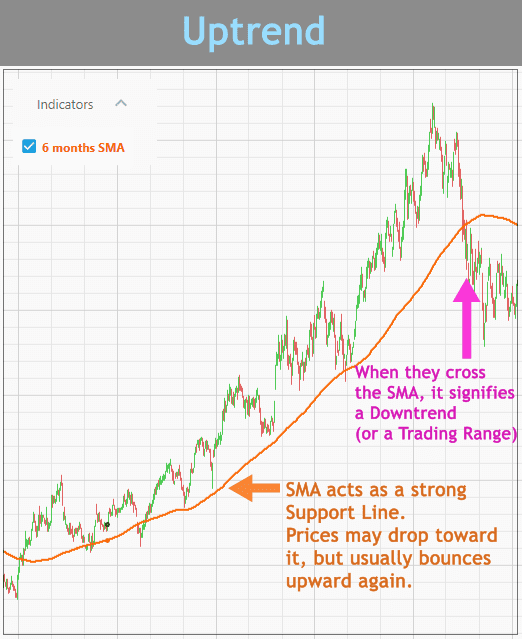
Simple Moving Average is a great indicator for establishing the support or resistance line of an instrument.
During an uptrend, if the closing-price is above the SMA, the instrument is in the safe zone (trend continues); while if it crosses below the SMA (the support line) the instrument may experience a reversal toward the downtrend.
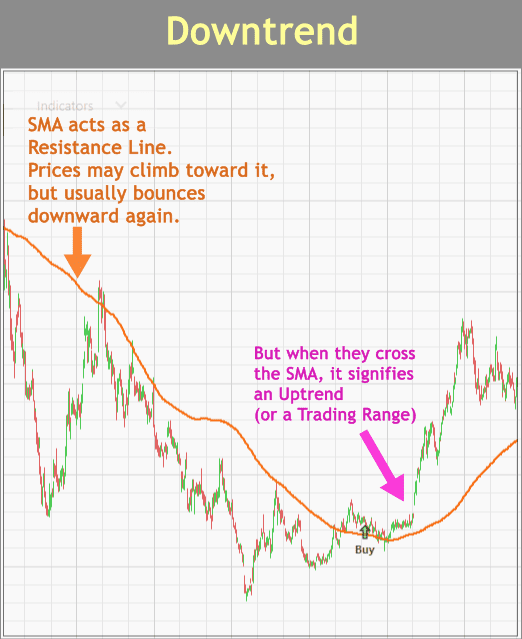
The reverse is true during a downtrend, in which the SMA acts as the resistance line. Prices rarely go above this resistance line, and if they do, a trend reversal toward the uptrend may happen.
Thus, this filter is useful either for trend confirmation, or, when you're looking at a discount when entering a Position (as long as the price dips not too far away below the SMA, it will eventually return above it).
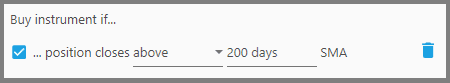
1. The first parameter defines whether the instrument's last closing-price must be “Above” or “Below” the SMA for it to be considered. Generally, for a Buy Filter set this to “Above”, since prices above the SMA may indicate the uptrend continues.
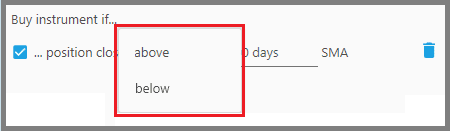
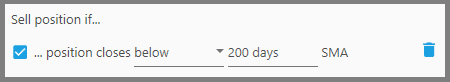
For a Sell Filter, set this to “Below” since prices below the SMA may indicate a downtrending instrument.
2. The second parameter defines the time-period that the SMA is calculated.
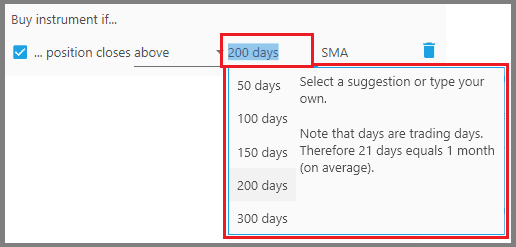
Let's say you want to see an instrument's SMA of the past 200 days, then input a value of 200 days here (type the value, and then choose from the dropdown).
Common SMA lengths are 10, 20, 50, 100, and 200 days. A 200 days SMA is calculated by adding all the closing-prices of the past 200 days, and the result is then divided by 200. So essentially, SMA smooths out the price noises and generates the average.
Keep in mind, deciding the length of the SMA is usually a tricky one: a longer SMA generates fewer signals but most of them are true, while shorter SMA generates more signals but most of them are false. Decide the length based on your trading duration (short term or long term).
Notes:
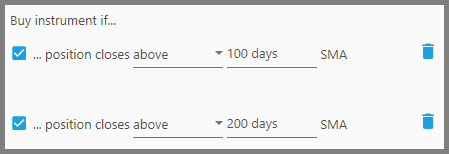
- You can use this filter twice, each with a different value. For example, a stock's closing price must be greater than both the 200 days SMA and 100 days SMA to be considered as a buy. This usually generates a greater return while minimizing drawdowns.
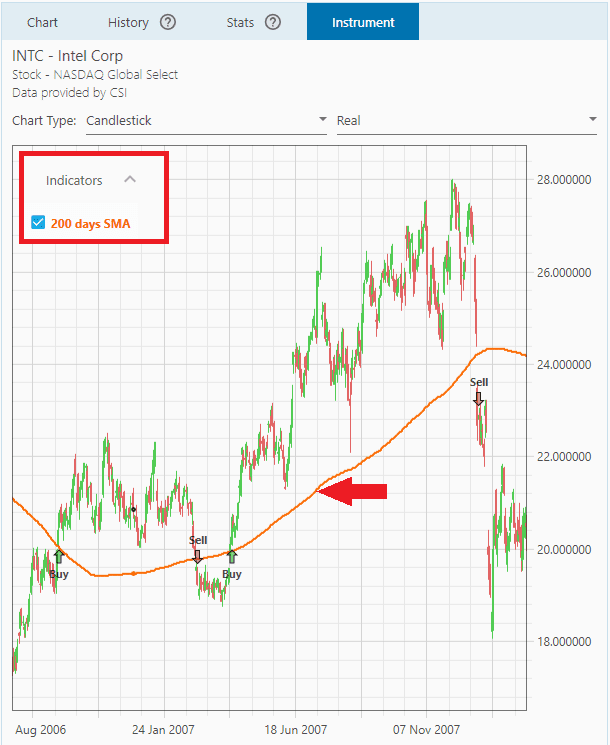
- The SMA indicator that you specified here will be overlaid on the Price Chart (at the Instrument Tab). Look whether the last closing-price is above or below that SMA line. Any changes you made to the SMA's period parameter will also change the SMA indicator immediately.
- You may want to include another filter that further confirms whether you're in a downtrend or an uptrend (e.g. the “Primitive Pattern Filter” or the “Moving Average Cross Over Filter”).
Discount Applied Successfully!
Your savings have been added to the cart.
Report
Block Member?
Please confirm you want to block this member.
You will no longer be able to:
- See blocked member's posts
- Mention this member in posts
- Invite this member to groups
- Message this member
- Add this member as a connection
Please note: This action will also remove this member from your connections and send a report to the site admin. Please allow a few minutes for this process to complete.
Report
