Volatility Range Filter

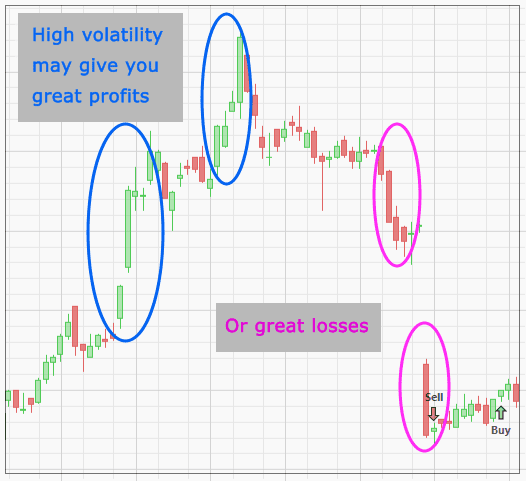
This filter looks at an instrument's volatility (the ups and downs of its price) to determine whether it will be bought or sold. This is good for example if you want to trade highly volatile, thus risky instruments, in the hope of generating higher returns (but beware of greater drawdowns).
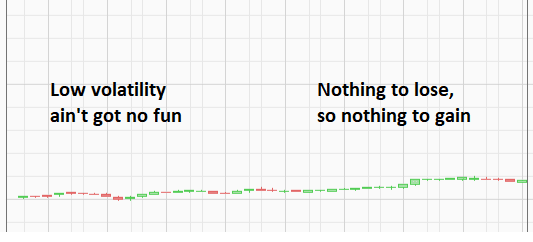
The reverse is also true, i.e. if you want to trade only stable instruments, thus reducing risk.
Now, about this filter's parameters:
1. The first parameter defines the period of time in which the volatility is calculated. Let's say you want to know a stock's volatility based on a period of 3 months, then input a value of 3 months here (type the value, then choose from the dropdown either Days or Months).
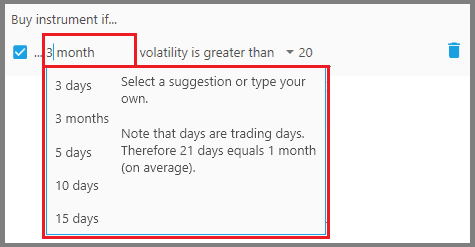
This means you're looking at the instrument's volatility calculated from today until 3 months ago (averaged).
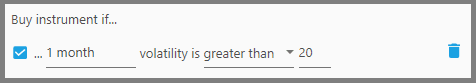
2. The second parameter defines whether the instrument's volatility must be “Less than” or “Greater than” the threshold volatility.
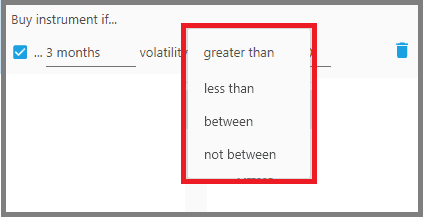
You may also choose “Between” or “Not between” the volatility values, thus you must set the minimum and maximum volatility values on the next two parameters that show up.
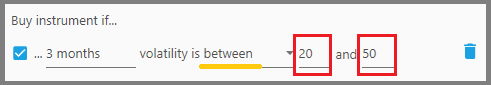
“Between” means the instrument's volatility must fall within the Min and Max values, while “Not between” means the instrument's volatility must fall outside the Min and Max values (you're looking at either very volatile or very stable instruments).
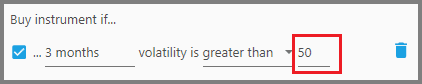
3. The third parameter defines the threshold volatility value. So for example, an instrument whose 3 months volatility is greater than this value will not be considered as a Buy, etc. This value is stated in percent, from 0 to 100. Higher percentage means higher volatility, and vice versa.
Notes:
- Once this filter is added to your strategy, a “Volatility” indicator appears just below the Price Chart (on the Instrument Tab), that shows the volatility of a particular instrument.
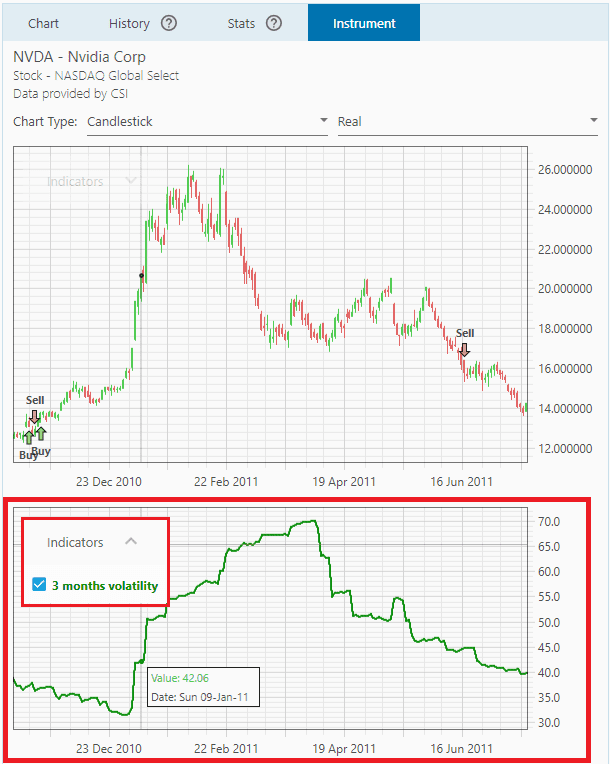
A high volatility reading means the price is fluctuating wildly (it goes up or down quite far); whereas low volatility indicates a stable price movement (day-to-day prices are not too different from each other during that period). This indicator immediately changes appearance when you change this filter's period parameter.
- Keep in mind, just like any indicators that use a period of time, this indicator is a moving window, which means every point on the volatility graph is the volatility reading from that point up to the beginning of the period.
- If you use this filter with the SMI filter, the Volatility indicator may not show correctly (shows flat line), since the chart has been “taken over” to show the SMI data. So, you must disable the SMI indicators by unchecking them from the indicators list.
Discount Applied Successfully!
Your savings have been added to the cart.
Report
Block Member?
Please confirm you want to block this member.
You will no longer be able to:
- See blocked member's posts
- Mention this member in posts
- Invite this member to groups
- Message this member
- Add this member as a connection
Please note: This action will also remove this member from your connections and send a report to the site admin. Please allow a few minutes for this process to complete.
Report
