Correlation Filter
This filter selects your instruments based on how correlated they are to an index (during a specified period). In other words, if an instrument moves perfectly in line with the index (whether up or down, and by the same amount) then the instrument is highly correlated to an index, and vice versa.
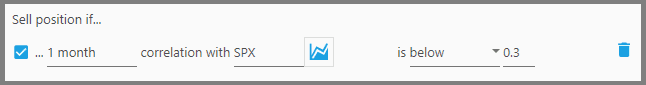
This is a good filter to make your portfolio mimic the behavior of a certain profitable index. For example, if S&P 500 is on a strong rally, you want to select instruments that perform the same way as that index. Or the reverse, you will sell Positions whose behavior start deviating from the index (remember that an instrument's correlation with an index continuously changes).
But beware that following an index closely exposes you to the market's systematic risks, that is, if the market suddenly crashes it's certain that you will crash too. Besides, closely following an index means you are not outperforming it, which is the goal for many traders.
Do note you may be tempted to use a stock or an ETF, instead of an index. For example, if you know Stock A's performance is gaining strong, you want to look for other stocks that mimic this behavior. But beware that a stock’s performance is much more variable than an index, so your backtesting result (going back decades past) may not reflect the current good performance of that stock, which means your strategy may be a fluke for the longer term.
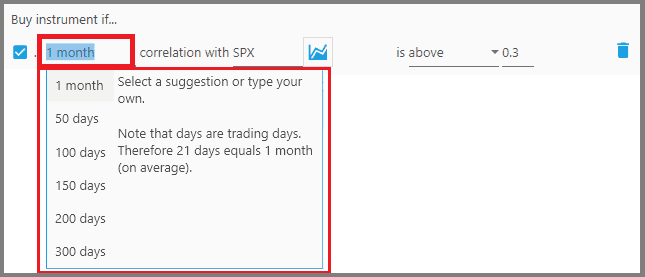
1. The first parameter defines the lookback period for the instrument's correlation to an index. A longer period means the instrument is consistently correlated that way with the index, and vice versa.
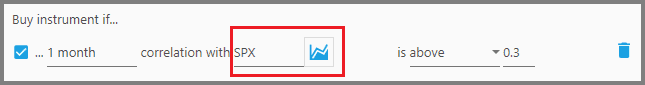
2. The second parameter defines what index (or another instrument) to compare against.
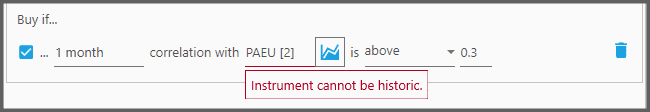
Keep in mind, you can't enter a delisted instrument here (those indicated by a number suffix inside square brackets). Otherwise a warning appears and you can't backtest the strategy:
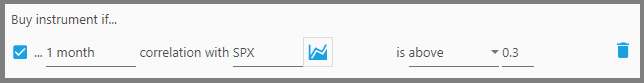
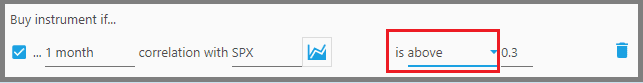
3. The third parameter defines whether the instrument must be “Above” or “Below” the threshold correlation value to be considered as a buy/sell.
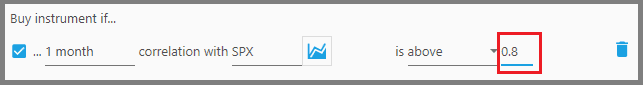
4. The fourth parameter defines the threshold correlation value for these instruments to be considered. A value of 1 means perfect correlation with the index, 100% mirroring its behavior. A lower value like 0.2 means a price behavior that is much less affected by the market (index).
You can also input a negative value, for example, a value of -1 means a perfect mirroring behavior that is opposite from the index; let's say, if the index moves 100.72 points upward, the instrument will move 100.72 points downward.
Do note, it is not recommended to perfectly mirror the index 100% (if that's actually possible), as explained before. So, if you want to follow an index, set this value at least 0.8; that way your Portfolio may outperform the index and has enough diversification to avoid the systematic risks.
Note:
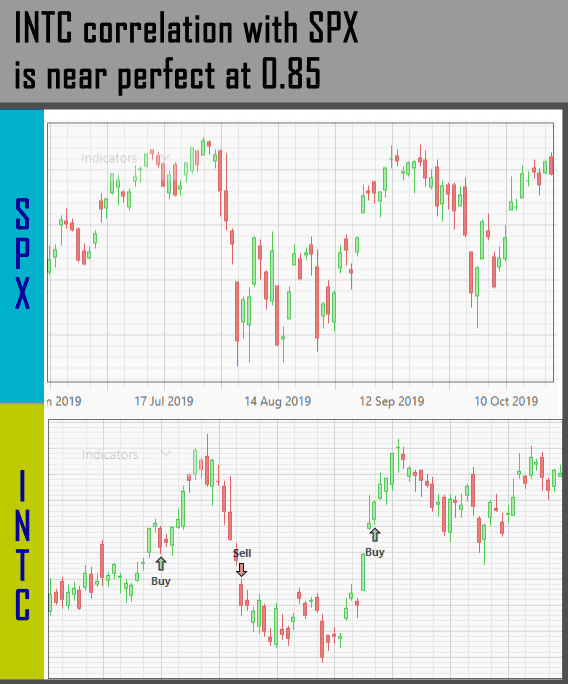
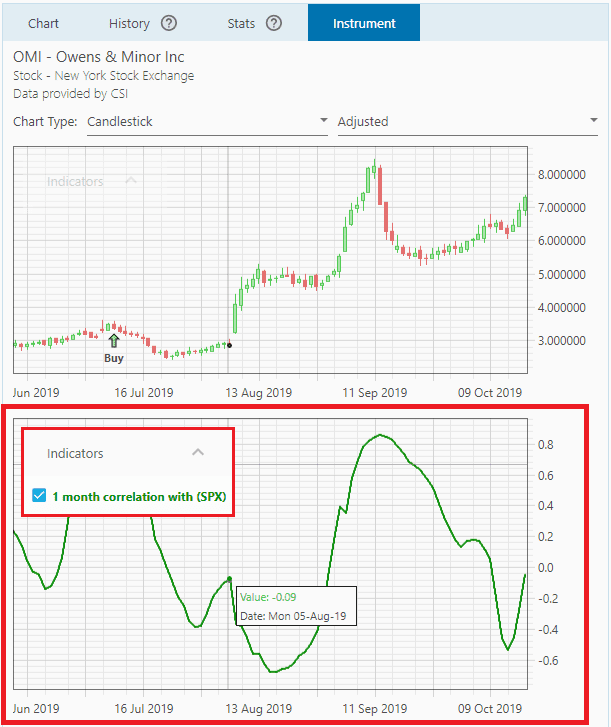
Once this filter is applied, a correlation indicator appears on the chart below the Price Chart (at the Instrument Tab). It shows how correlated the selected instrument is to the index, during the specified period.
Discount Applied Successfully!
Your savings have been added to the cart.
Report
Block Member?
Please confirm you want to block this member.
You will no longer be able to:
- See blocked member's posts
- Mention this member in posts
- Invite this member to groups
- Message this member
- Add this member as a connection
Please note: This action will also remove this member from your connections and send a report to the site admin. Please allow a few minutes for this process to complete.
Report
