N ATR Above/Below SMA Filter
This filter will consider an instrument based on how far the last closing-price of that instrument goes above or below the Simple Moving Average. It's rather similar to the Bollinger Bands in that the closing price must fall within or outside the walls (bands), except there's only one wall here, and its distance is measured through ATR instead of Standard Deviation of the prices.
To understand this filter, we must understand what an ATR is: Average True Range measures the instrument's volatility (in dollar value) for the past certain days (or months), and as such, it doesn't give any specific signals on whether to exit or enter positions. ATR only tells you: the instrument usually goes up or down x dollar amount per day, during the past certain period.
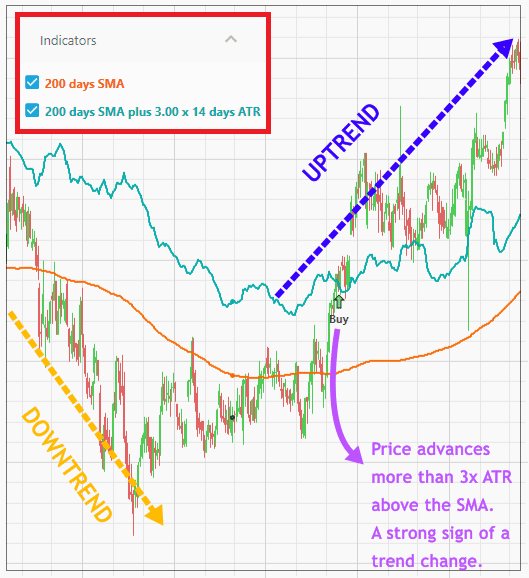
Now, the general Technical wisdom says if a downtrending instrument goes above the SMA 3 times the ATR (or greater), then it is likely to reverse direction toward an uptrend. Or if it's an uptrending instrument, then such a price spike above the SMA is a confirmation the uptrend continues.
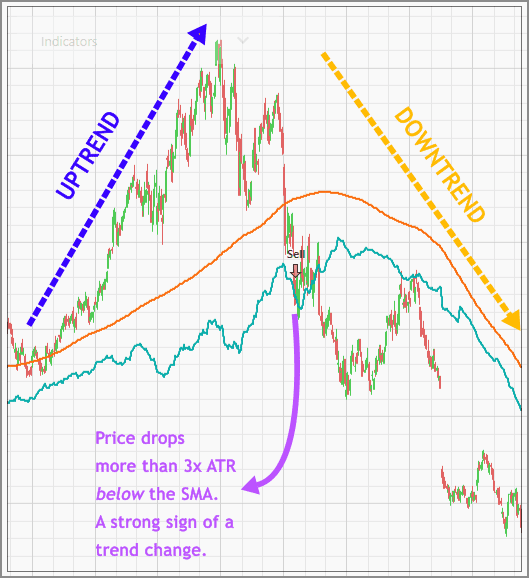
The reverse is also true: if an uptrending instrument goes below the SMA up to 3 times the ATR, it is likely to reverse toward a trading range (or even a downtrend). This is because SMA acts as a strong support or resistance line for the instrument, so if an instrument breaks that line quite far, there's a strong possibility of a trend change.
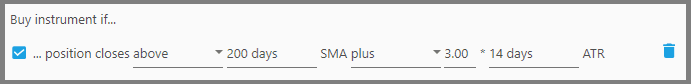
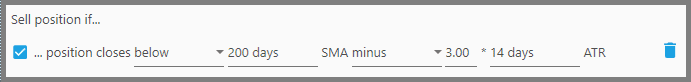
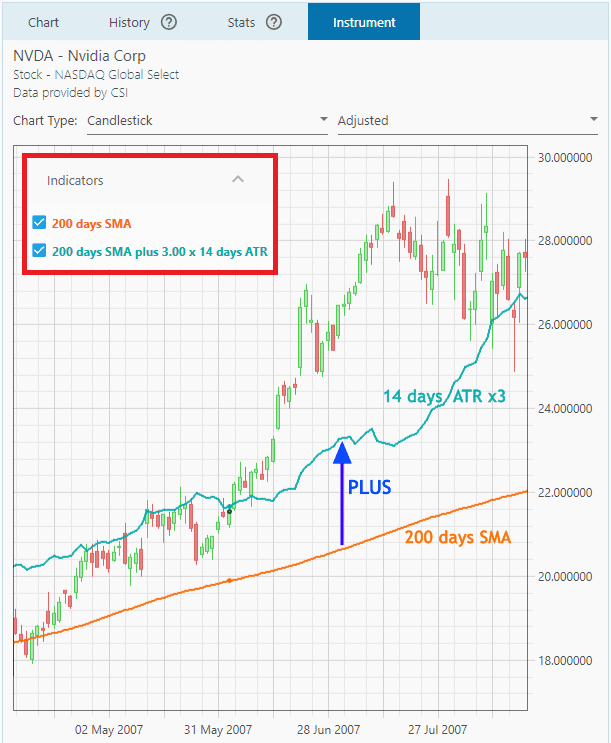
In plain language, this filter will buy (or sell) an instrument if the instrument closes “above/below” the SMA-ATR indicator. The SMA-ATR indicator is defined as:
- the past “x days” SMA “plus/minus” the multiplied-ATR for the past “y days”.
Such indicator will be overlaid on the Price Chart, and will change immediately according to the parameters you set on this filter. There's also the SMA indicator overlaid on the Price Chart (based on the SMA period you specified in this filter).
As a tip, it's better to use this with another filter that defines whether the instrument is uptrending or downtrending.
So, here's the explanation for the parameters:
1. The first parameter, “above/below”, defines whether the instrument must close above or below the SMA-ATR indicator for it to be bought (or sold). Generally, for a Buy Filter you want to set this to “Above”, while for a Sell Filter set it to “Below”.
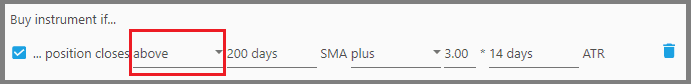
But again, it all depends on what you want to use this filter for. If you're using this filter to look for discounts when entering positions, then set this parameter to “Below”.
2. The second parameter, “x days” SMA, defines the period to look back for the Simple Moving Average of that instrument. For example, if you're a swing trader, this period shouldn't be too long.
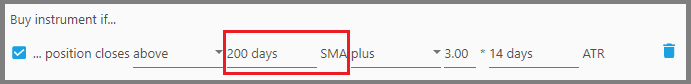
But if you're trading longer term, a shorter period usually gives more false signals, thus enter a longer period here.
3. The third parameter, i.e. “plus/minus”, defines whether the SMA-ATR indicator should be above the SMA (“plus”) or below the SMA (“minus”). Again, for a Buy Filter this is usually set to “plus”, whereas Sell Filter is usually set to “minus”.
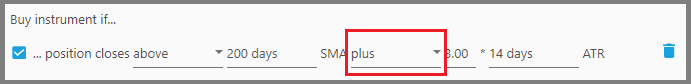
How far that indicator is above/below the SMA is defined on the next ATR parameters.
4. The fourth parameter, e.g. “3”, is the multiplier to the ATR value.
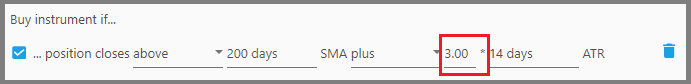
For example, an exit signal will be given if the instrument's price falls further than the: SMA minus 2x ATR, then set this parameter to “2” (which means the threshold price is 2 times the ATR below the SMA).
Values up to 3 times the ATR are generally used for trend confirmation or reversal. But if you're merely looking for a discount when entering positions, set this at a fraction of the ATR.
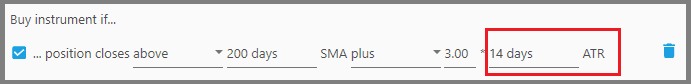
5. The fifth parameter, i.e. “y days” ATR, defines the length of the ATR period. Again, if you're a short-term trader use a shorter period here to look for the ATR, for example 5 days, and vice versa. For normal trading, set it to 14 days.
Note:
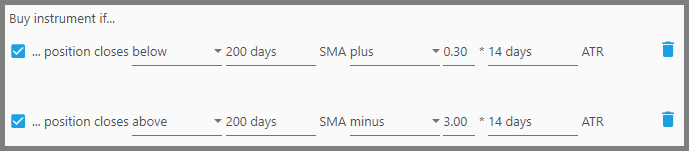
If you're using this filter to look for discounts, make sure to use this filter the second time (as another Buy Filter). This second filter makes sure that the instrument's price is above the SMA-ATR indicator, and this SMA-ATR indicator is set to 3x ATR minus the SMA.
The first filter on the other hand, looks for instruments that close below the SMA-ATR indicator, and its SMA-ATR indicator is set to a fraction of the ATR plus the SMA. Look at the picture below:
Discount Applied Successfully!
Your savings have been added to the cart.
Report
Block Member?
Please confirm you want to block this member.
You will no longer be able to:
- See blocked member's posts
- Mention this member in posts
- Invite this member to groups
- Message this member
- Add this member as a connection
Please note: This action will also remove this member from your connections and send a report to the site admin. Please allow a few minutes for this process to complete.
Report
