Bollinger Bands (BBands) Filter
Bollinger Bands help you avoid the mania of buying and the panic of selling, by anticipating price movement before it happens.
This filter is based on the principle that price tends to fluctuate (rebound) at key inflection areas. Such inflection areas (support and resistance) are represented by the “moving average” line and the two parallel lines above and below such moving average.
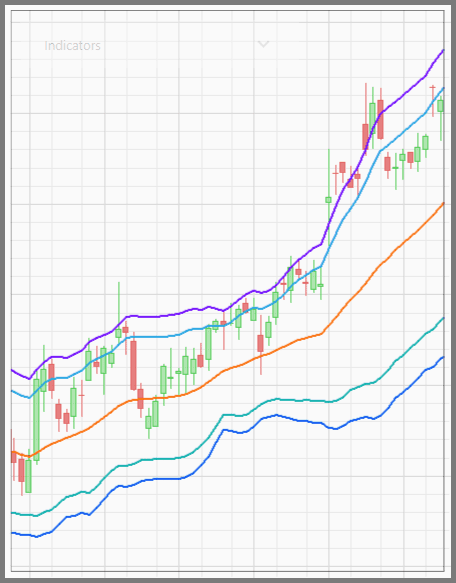
For example, take a look at an uptrend here:
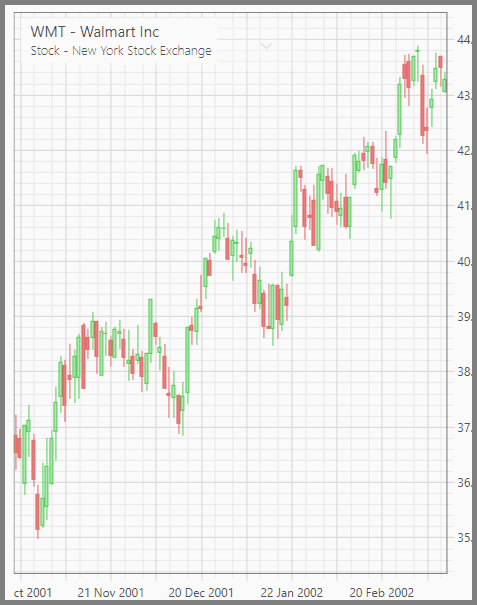
As you can see, despite a strong uptrend, we have undulating moves up and down. Prices seem to rebound on invisible walls. Wouldn't it be nice if we can “see” those walls? Such walls represent not only buying, but also selling opportunities even in an uptrend.
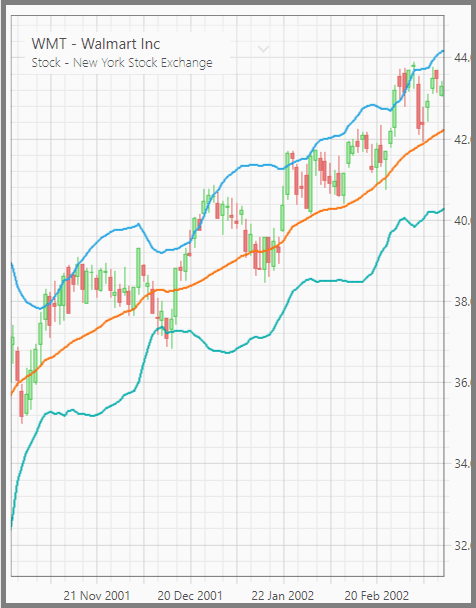
The Bollinger Bands filter allows you to see such walls; the three “walls” where prices are most likely to bounce:
- The upper band
- The Moving Average line
- The lower Band
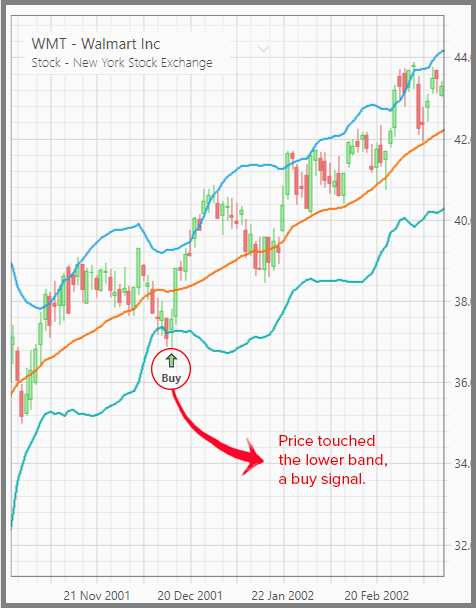
When the price touches the lower band, there's a good chance it will rebound upward, so you go long (buy).
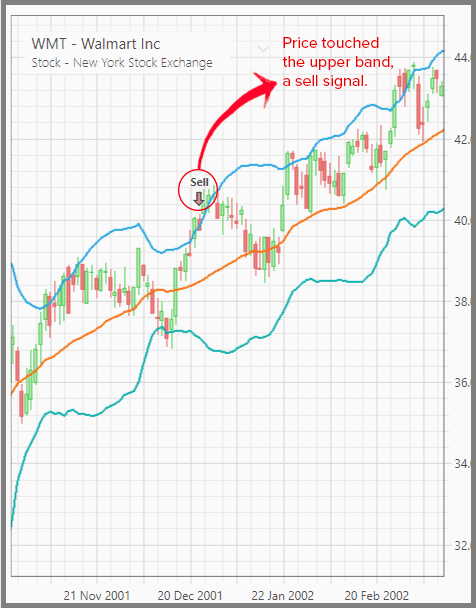
When the price touches the upper band, it's likely to rebound downward, so you sell short or sell for profit.
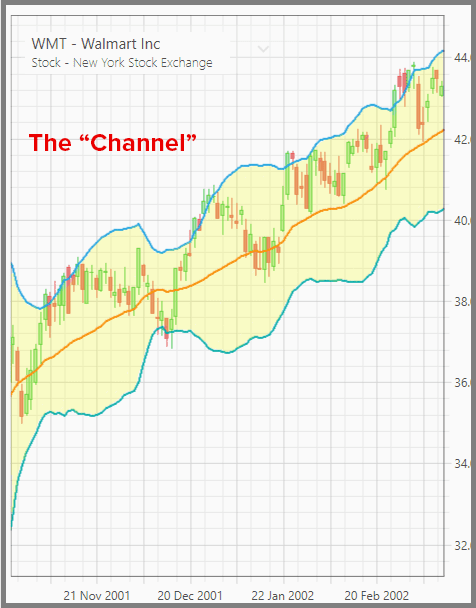
In summary, price tends to bounce around within a channel; a channel defined by the upper and lower Bollinger Bands.
Well, at least that's the general principle. Now, let's get to the more specific rules:
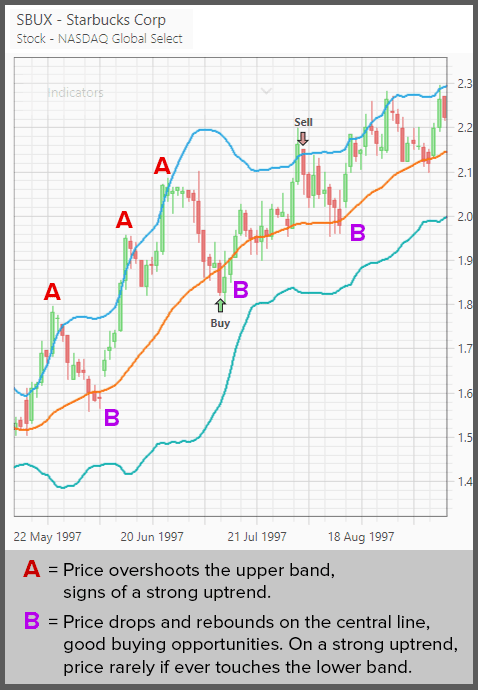
- During an uptrend, when price overshoots the upper band, it's a confirmation that the uptrend is strong and will likely to continue. But expect the price to drop a little toward the Moving Average line. When it does so, it's a good buying opportunity. Sell when the price nears the upper band again. Under no circumstances should you short an instrument with such strong uptrend.
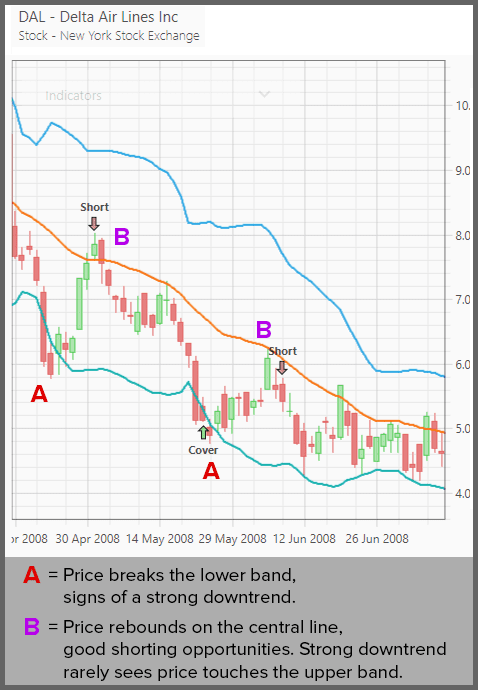
- Conversely during a downtrend, when price drops lower than the lower band, it confirms a strong downtrend. Expect the price to rise a little, toward the Moving Average line. When it does so, it's a good shorting opportunity. Cover when the price nears the lower band again. Under no circumstances should you go long (buy) on such a strong downtrend.

- Now when there is no clear trend, such as in a trading range, it's almost always a good opportunity to buy near the lower band, and sell (or sell short) near the upper band. Price tends to cross the moving average from one band to the other.

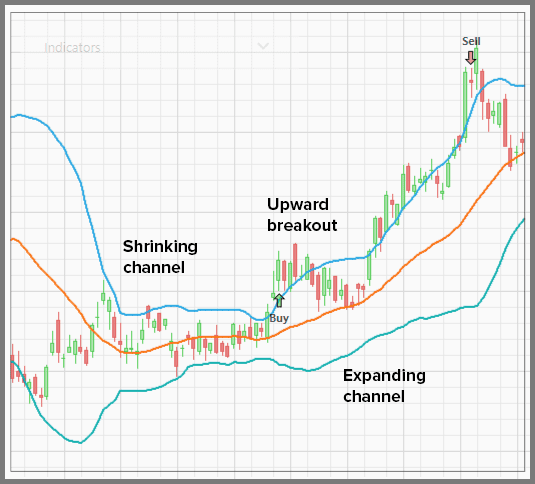
- When price moves in a narrow channel (narrow relative to the previous action), the subsequent explosion of the channel, along with the price breakout outside of the channel usually signal an explosive new trend forming. For example, the price moved in a trading range with its narrow channel, and subsequently it overshoots the upper band along with the expansion of the channel. This signals a fresh uptrend forming.
Now let's get to the filter's parameters:
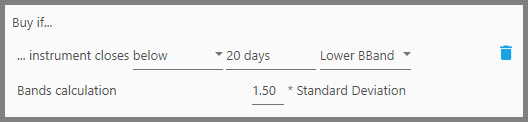
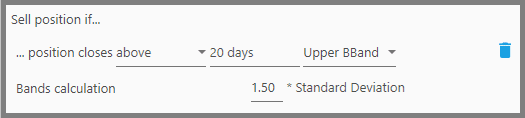
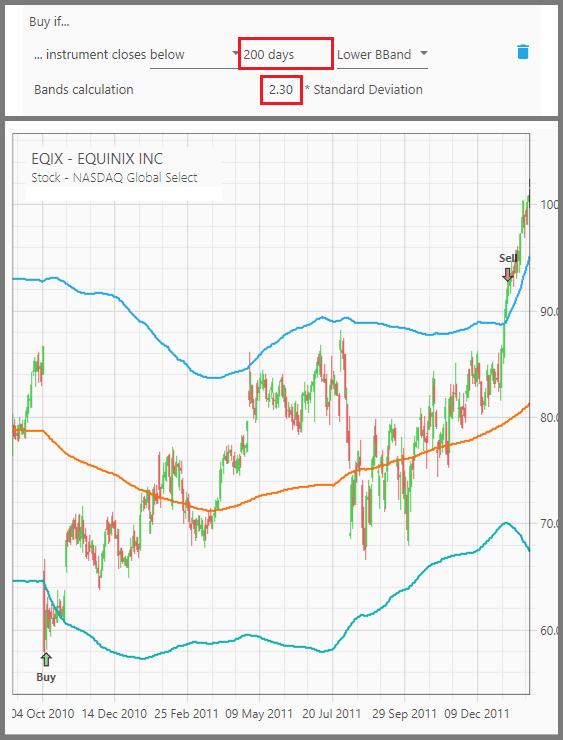
1. The first parameter defines whether the closing price must be “Above” or “Below” one of those walls.

For example, it's always a good idea to sell when price is over-exhausted above the upper band. So you set this parameter as “Above”.
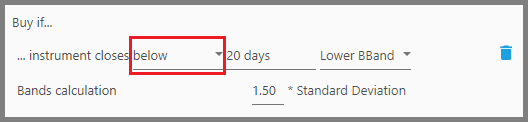
Conversely, it's also a good idea to buy when price breaches below the lower band. So you set this parameter to “Below”.

2. The second parameter defines the period for calculating the Moving Average, hence also the period for the upper and lower bands.
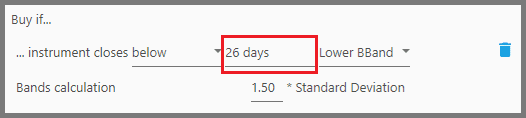
The default period is 20 days, as recommended by John Bollinger (the inventor of the Bollinger Bands). That means we'll have a 20-days Simple Moving Average as the central line. The upper and lower bands are then derived from that 20-days SMA.
But really you can set this period to whatever you find best. I like mine set to 26-days. Longer periods tend to give signals based on long term trends, while shorter periods allow you to exploit smaller trends (pullbacks or corrections).
Exploiting longer trend allows you to enjoy hefty price increase during such long period. But it comes with a price: trades happen much less frequently thus less profit, and that you may experience great drawdowns during that long period.
3. The third parameter defines which “wall” you'd like to set as the reference.
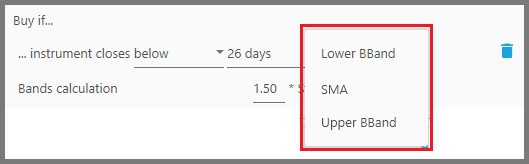
You can choose between the “Upper BBand” (upper band), the “Lower BBand” (lower band), or the “SMA” (the Moving Average as the central line).
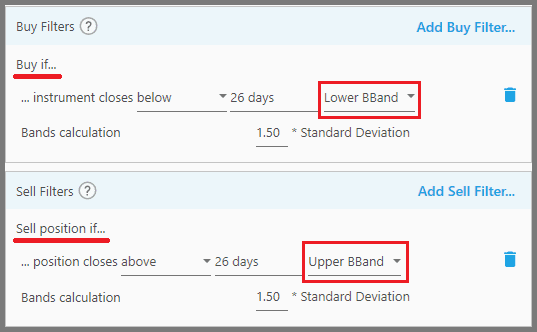
For example as explained previously, you believe a buy signal is best represented by the lower band, and a sell signal by the upper band. So you set a buy filter to use the “Lower BBand”, and a sell filter to the “Upper BBand”.
The “SMA” option can be used during a strong trend, where you enter a position as the price approaches the central line.

This application is rather ambiguous though, as the price may actually close at one of the outer bands. So it's best used with another filter.
4. The fourth parameter defines the coefficient for the Standard Deviation.

In practical terms, this parameter allows you to expand or shrink the channel.

But you may wonder, what is Standard Deviation?
In layman's terms, Standard Deviation is how much the price deviates from the average. This allows the Bollinger Bands to automatically expand and contract based on price volatility. The greater the volatility, the wider the channel, and vice versa.
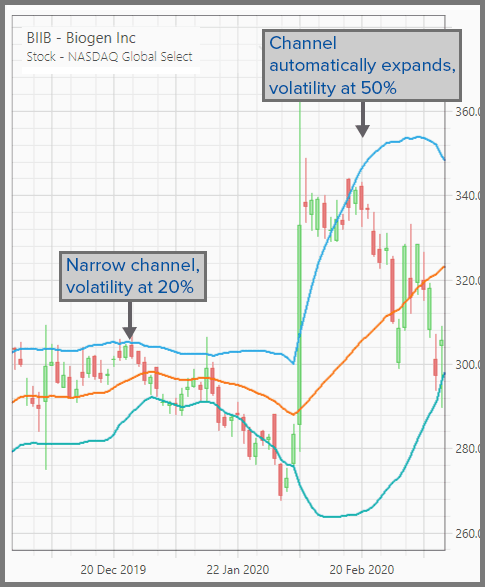
During a trading range, the channel automatically shrinks to account for the low volatility of price. Imagine if the channel stays wide: price won't touch anywhere near the upper & lower bands during period of low volatility, thus no buy/sell signals are given, and you can't profit during periods of different volatility.
Note that Standard Deviation affects only the upper and lower bands:
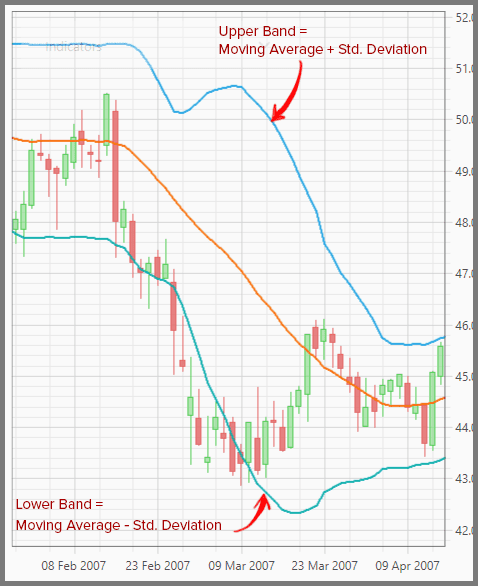
This is what separates the Bollinger Bands from the standard “envelope”, in which the channel's width stays the same. As such, Bollinger Bands are perfectly suited for a strategy that aims to cover decades of price action, where volatility changes frequently. Even better, it's automatically adapting to the thousands of different instruments such as contained in Portfolio Boss.
But it happens that the channel could not capture the price action correctly, even with Standard Deviation. And so this parameter allows you to “multiply” the Standard Deviation.
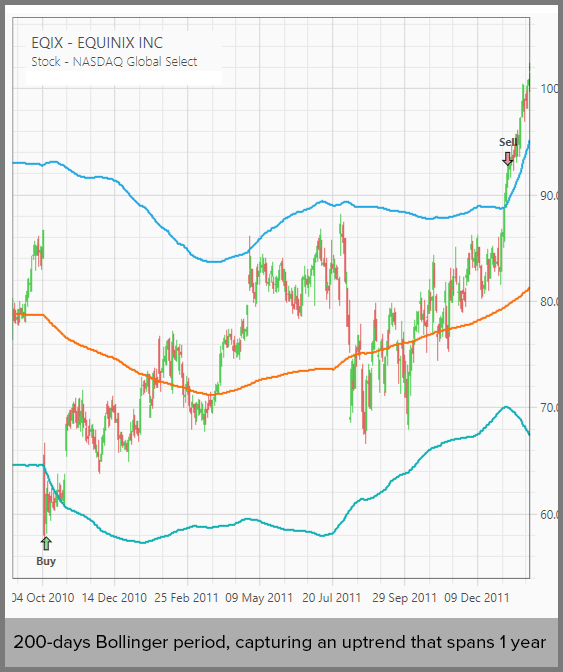
For example, if you use a longer Bollinger period to capture longer & bigger trend, it's useful to increase this parameter so the channel expands, giving you more correct signals.
A value of 1 means the Standard Deviation is not multiplied whatsoever. A value greater than 1 means the Standard Deviation is increased/multiplied, thus the channel expands. While a value less than 1 means the Standard Deviation is reduced/divided, thus shrinking the channel. We set the default value at 1.5, although John Bollinger also recommended a value of 2 or greater, for a presumably longer period.
As with any technical analysis, the rules set out above are not a guarantee. In fact, it's best to use this filter with other filter(s), to eliminate any ambiguity.
For example as we discussed previously, during a strong uptrend you want to buy when price “nears” the central line. So you set the filter to trigger when price closes “Above” the “SMA”. But how much is “Above”? Above could mean anywhere near the central line, or far beyond the upper band. So you use another filter, the “SMA Position Filter”, to define where the price must fall:
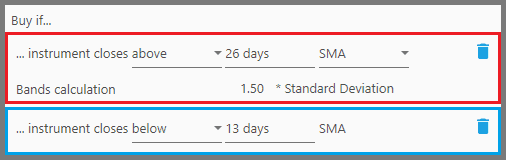
As you can see on the picture above, price must close “Above” the Bollinger's 26-days SMA, and also “Below” the 13-days SMA Position filter. That way, not only you define the price must fall “near” the central line, but also you make sure it's a clear uptrend you're trading, as the 13-days SMA can only be above the 26-days SMA during an uptrend (Moving Average cross-over, where the faster MA is above the slower MA). It's impossible for the price to close below the 13-days SMA and above the 26-days SMA, when the 13-days SMA is below the 26-days SMA (a downtrend).
And then as a polishing touch, you set a sell filter to trigger when price breaks above the upper band.

Another scenario is to trade an “explosive” new trend, when the Bollinger channel narrowed and subsequently expands, as already explained before. With this filter alone, it's impossible for the strategy to tell whether the Bollinger channel has narrowed and expanded. And so we use other filters to define such criteria:
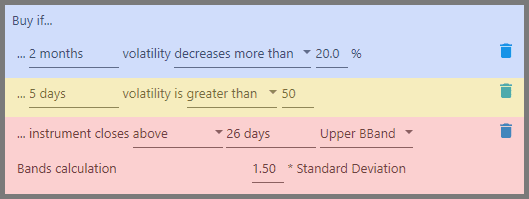
As you can see above, we use three buy filters. The first, “Volatility Change Filter” sees whether price volatily has been decreasing by 20% during the past 2 months. This makes sure the Bollinger channel was shrinking during the past 2 months. The second filter, “Volatility Range Filter” sees whether price volatility suddenly spikes more than 50% recently (past 5 days). This ensures that, very recently, the Bollinger channel suddenly explodes. But sharp price action could mean both ways, either up, or down. And so the third filter, “Bollinger Bands Filter” ensures not only of an uptrend, but a strong one at that. This is achieved by capturing the closing price above the upper band.
Then add a sprinkle of a sell filter. During strong uptrend, it's not uncommon for price to overshoot the upper band, so obviously we can't use the Bollinger Bands (sell when price closes above the upper band; it's premature). We want to ride the strong uptrend as long as possible. Thus comes the “RSI Filter”.

That tells the strategy to exit the position once the RSI exceeds 70. That's an overbought condition, so we want to take profit before the bulls are exhausted, not after. Sometimes RSI may shoot upward of 80 during a strong uptrend, but we want to be safe here, not chasing that castle in the air.
Notes:
- The indicators (upper band, central line, and lower band) are overlaid on the price chart when you open the “Instrument” Tab. Make sure to backtest the strategy first.

- For the buy filters, you can stack multiple Bollinger Bands filters to spawn multiple channels. Make sure they have the same period settings, but different coefficients (different multiplier for the Standard Deviation).
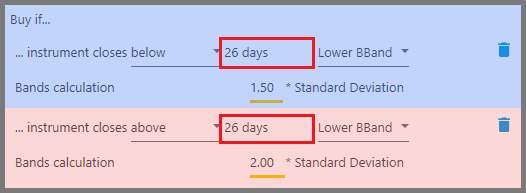
You can use this for exotic purposes (if you're a believer in multiple channels). But remember, this only applies for entering a position (buy filters). Sell filters are executed with the “OR” operator, so multiple Bollinger Bands filters won't work together as one.
Discount Applied Successfully!
Your savings have been added to the cart.
Report
Block Member?
Please confirm you want to block this member.
You will no longer be able to:
- See blocked member's posts
- Mention this member in posts
- Invite this member to groups
- Message this member
- Add this member as a connection
Please note: This action will also remove this member from your connections and send a report to the site admin. Please allow a few minutes for this process to complete.
Report
