Stats Tab
THIS PAGE IS BEING RENOVATED
This tab shows the performance of those instruments traded by the strategy during the whole backtest period. It shows the gain and holding-duration statistics for their Positions. So, before we entered them as Positions we could only guess how they would perform. But here you have a 20/20 “hindsight” on the true colors of these instruments, once they're subjected to your trading theory & system. But it's recommended not to cherry-pick them to be part of your future portfolio, that is, sift out the losers and retain the winners.
This tab is located at the Reports Area of the “Backtest Strategy” page:
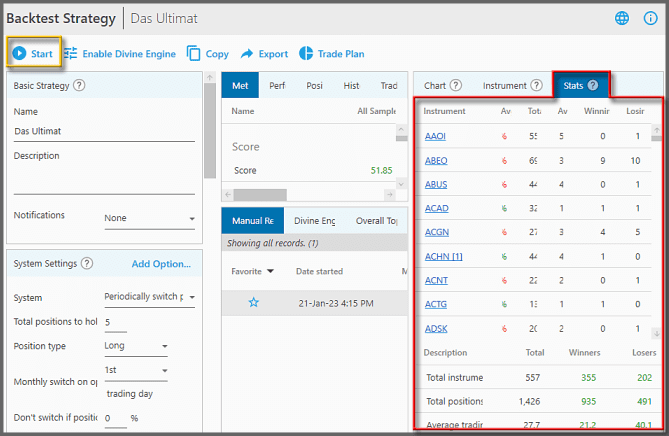
As usual, this tab is only populated once the strategy is backtested (by clicking the “Start” button at the top of this page).
1. Instrument: this column lists all the instruments that had been entered as Positions. Those instruments (on the strategy's portfolio) that were never entered as Positions aren't listed here.
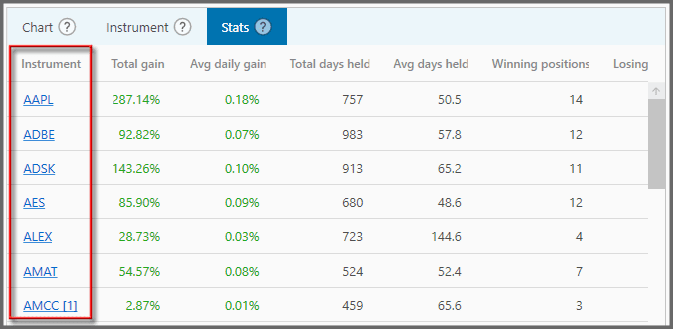
This is a good place to click a symbol and load it to the Instrument Tab, so you can analyze how that instrument reacted to the various indicator lines there. You can then adjust your strategy accordingly. But note, while you're adjusting the strategy (and backtesting it numerous times), reserve a big chunk of the available data to be unseen by Portfolio Boss. You can do this through the super out-of-sample method.
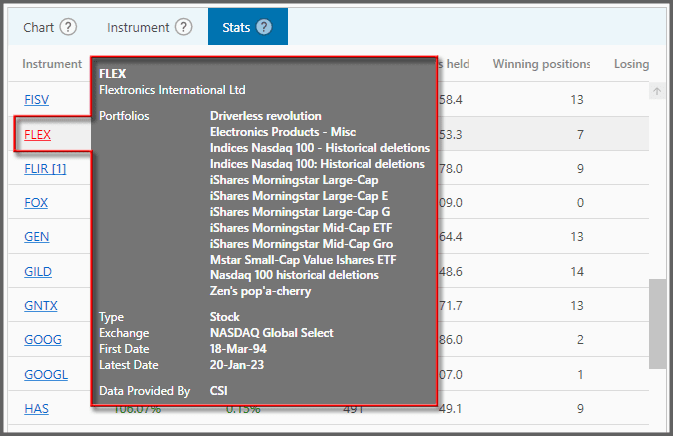
As usual, you can hover your mouse over a symbol to see its description tooltip:
2. Total Gain: this shows each instrument's total gain from all its Positions (up to the backtest end-date).
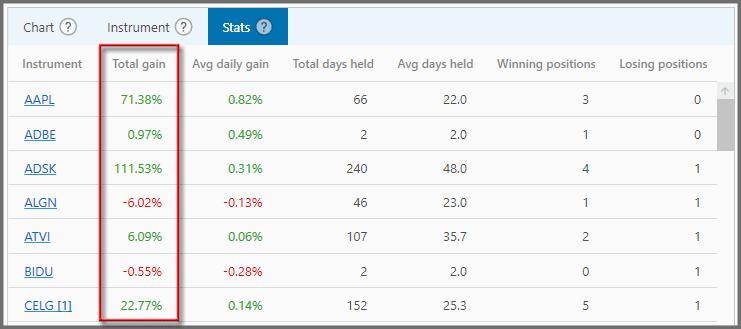
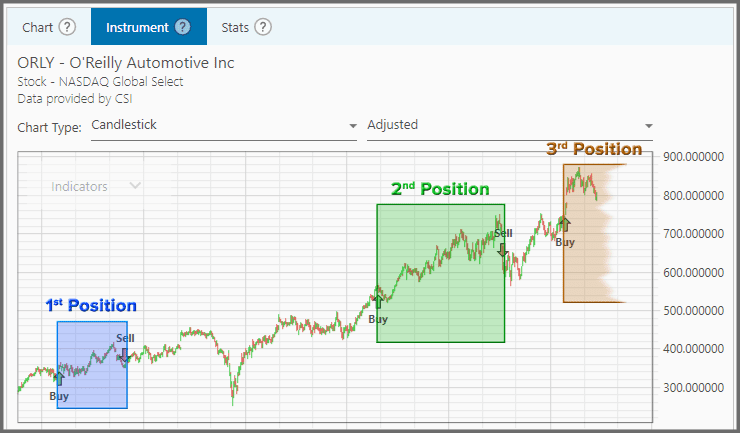
Each Position's gain is calculated from the entry price (Buy) to the exit price (Sell). If the latest Position isn't closed yet, the gain for that Position is gauged by the closing price on the latest backtest date. All prices are adjusted price.
But keep in mind, the calculation for “Total Gain” is not as simple as adding together each Position's gain or loss. It also takes into account the growth of your investment due to the previous Positions' gain. Hence the “Total Gain” you see here is a percentage for the very first Position's initial fund size (weight).
The calculation for the very first Position is:
Total Gain = 1 * (1 + Position Gain)
Then for the subsequent Positions:
Total Gain = Previous Total Gain * (1 + Position Gain)
The resulting final value is then subtracted from 1, to give you this “Total Gain” percentage for each symbol.
For example: AAPL had three Positions, each with a gain of 2%, 5%, and 3%. The “Total Gain” in relation to AAPL's initial fund size of, let's say $10,000, would be 10.31% or $1,031. If we simply add together 2% + 5% + 3% we'd get 10%, or $1,000, which would be incorrect, as it doesn't include the growth of your account (due to previous Positions' gain/loss).
3. Avg Daily Gain: this column shows the average daily gain (or loss) for all Positions of the instrument.
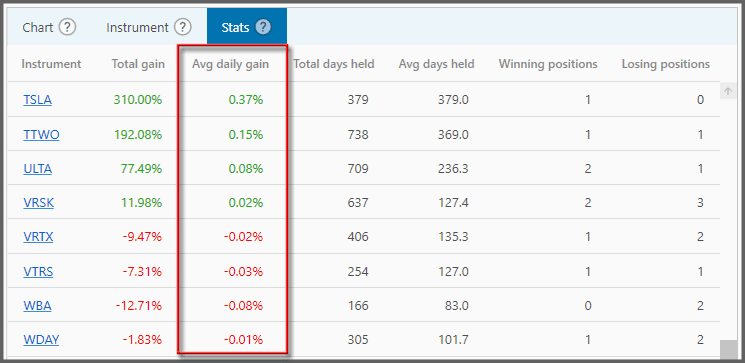
It's not simply the total gain divided by the total duration of those Positions, because that still wouldn't be representative of the average daily gain vis-à-vis your account growth. The calculation is rather complex:
A. “Total Gain” is divided by 100, to become a factor of 1. Then add 1 to the result.
B. Find the percentage that 1 day represents out of the total duration, so 1 is divided by the total duration.
C. Then raise A to the power of B, that is: A ^ B. Then subtract the result by 1.
D. Finally to make it a true percentage (not a factor of 1), multiply C by 100.
4. Total Days Held: here's the total duration (in days) that each instrument was held as Positions. Obviously it excludes holidays and weekends.
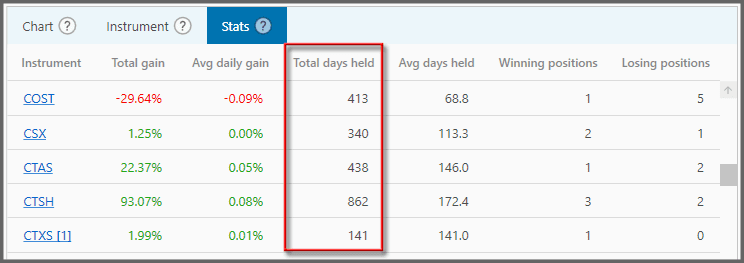
If the latest Position isn't closed yet, its duration is from the day it's entered up to today (or the backtest end-date).
5. Avg Days Held: this column tells you the average duration of the Positions (in days), for each instrument.
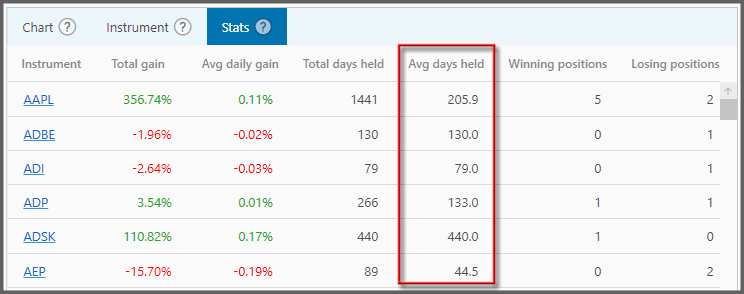
It's simply the total days it's held as Positions, divided by the number of Positions.
6. Winning Positions: it shows the number of profitable Positions that each instrument yielded.
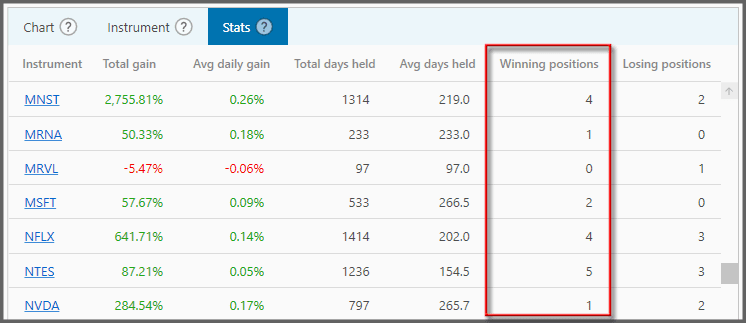
Profitable is when the exit price is higher than the entry price (if going long). Or if it's a short Position, exit is lower than entry. For a Position not yet closed, the closing price today is the gauge whether it's profitable or not.
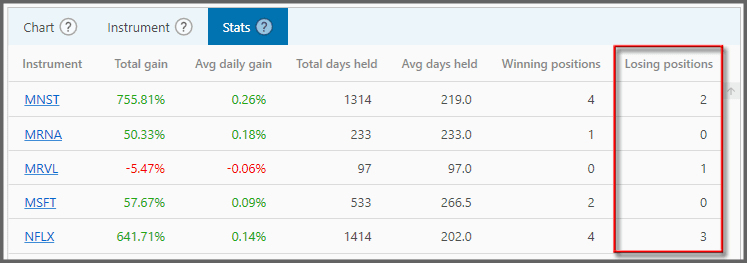
7. Losing Positions: this column shows the number of unprofitable Positions each instrument yielded.
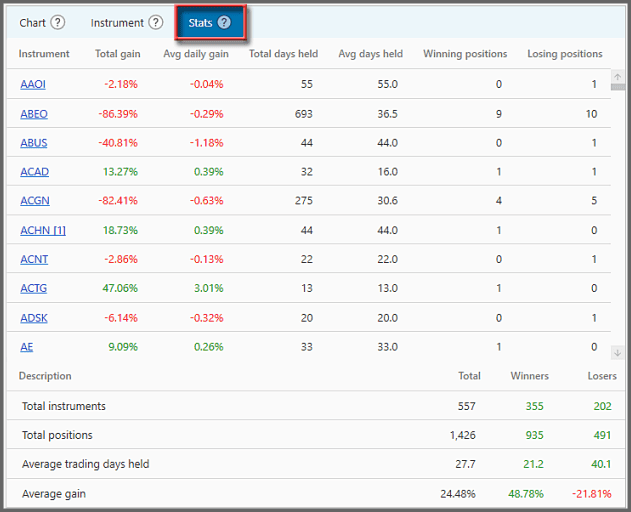
8. At the bottom of this tab there's a section for total statistics:
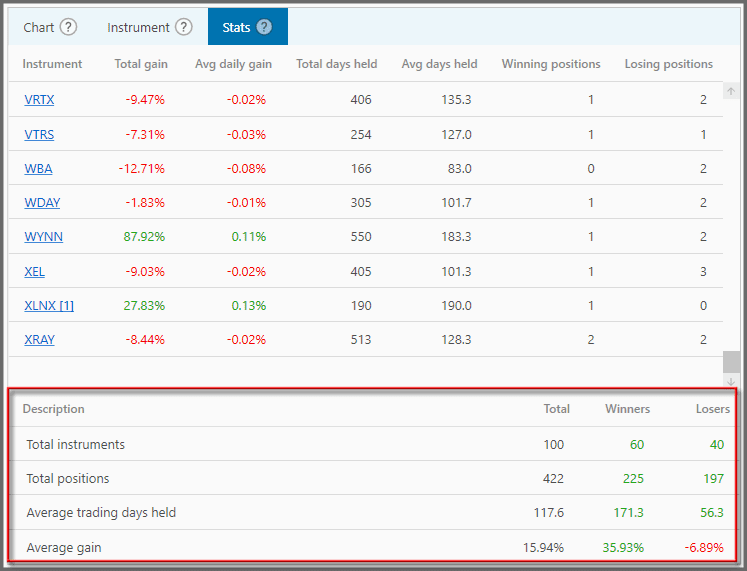
- Total instruments: The number of distinct instruments entered as Positions, including the cash-equivalent instrument.
- Total positions: The number of Positions entered.
- Average trading days held: how long each Position lasts on average, and
- Average Gain (shows the average gain for all Positions). [BOOKMARK]
The “Winners” column shows those statistics for profitable instruments (or Positions), whereas the “Losers” column is for unprofitable instruments (or Positions).
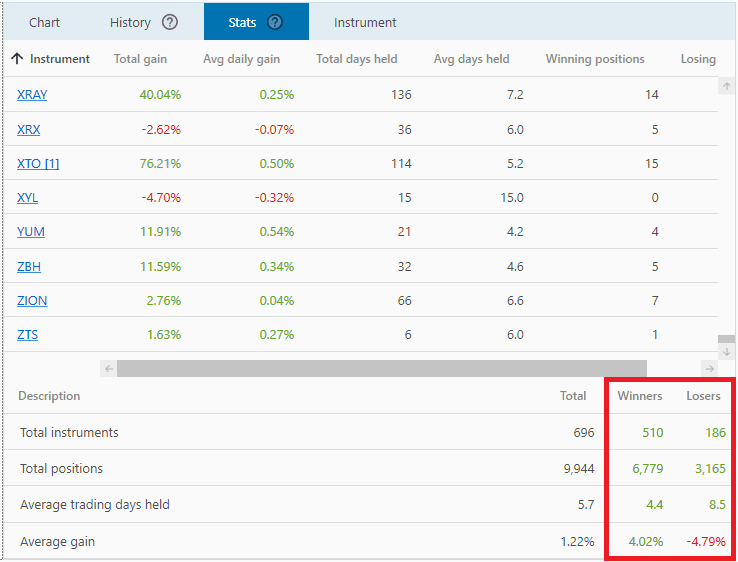
For example, as shown in the picture, there are 510 profitable instruments v.s. 186 unprofitable instruments, and there are 6,779 profitable Positions v.s. 3,165 losing Positions.
Note:
- All columns here are sortable by clicking the columns' header. For example, if you want to sort instruments from A to Z or from Z to A, or sort based on the highest returning instruments, etc.
Discount Applied Successfully!
Your savings have been added to the cart.
Report
Block Member?
Please confirm you want to block this member.
You will no longer be able to:
- See blocked member's posts
- Mention this member in posts
- Invite this member to groups
- Message this member
- Add this member as a connection
Please note: This action will also remove this member from your connections and send a report to the site admin. Please allow a few minutes for this process to complete.
Report
