Trade Plan Calculator
Trade Plan Calculator helps you calculate the number of shares you need to buy and sell, instead of researching the price and calculating manually. This tool can be used anytime even if there are no trading signals today (or the latest backtest date); for example if you start following a strategy at an arbitrary time when there are no trading signals. You can see trading signals from the Trade Signals Tab (or the email notification sent to you by Portfolio Boss).
So, once you receive these signals, calculate the amount of shares to buy/sell with this tool, and then enter the orders to your broker so he'll execute them tomorrow. If you have Interactive Brokers as your broker, you can also pile your orders into a basket file so they're automatically executed by IB's Trader Workstation.
Note that some licenses don't have access to this Calculator (there's no “Trade Plan” button). Please contact our Customer Support if you wish to upgrade your license.
1. To access this tool, click the “Trade Plan” button at the top of the “Backtest Strategy” page.

2. The tool shows up empty. So you must enter the amount that you will fund this strategy, by using the parameter “Enter Your Portfolio Amount”. Then click the “Calculate” button.
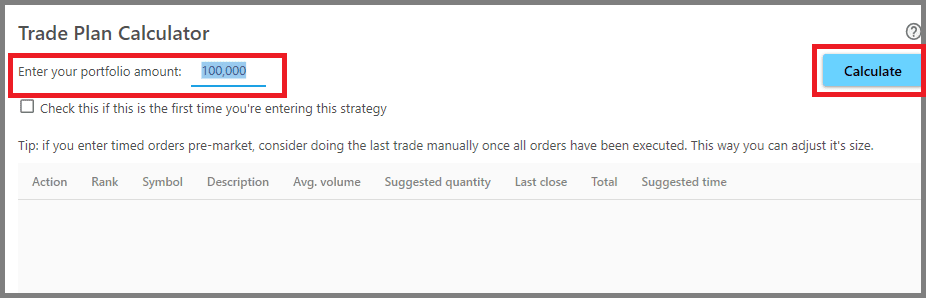
- If this is the first time you're trading with this strategy, you can enter whatever amount you like, for example $100,000; this tool will automatically calculate how many shares you'll buy on each instrument.
- If this is a switch day, you can also enter whatever amount you'd like to invest further into the strategy. For example, you want the previous profits liquidated into hard cash (to buy a new house, for example), then enter whatever remaining amount you'd like to fund the next round. If your account size shrunk due to losses in the previous month, enter whatever remaining amount you have (look at your brokerage account's size).
- If this is not a switch day, for example a Position hits the Sell Filter and you must buy new shares to replace it, then enter your current account size (look at your brokerage account). The Trade Plan Calculator will automatically calculate how many shares to buy for replacing that sold Position, based on that current account size. Ditto if you're trading a Continuously Switching Strategy (one that doesn't have a switch day), you must enter your current Portfolio amount in the calculator.
It's okay if you liquidate all your Positions outside of the switch day, although that means you're no longer following this strategy's suggestions, which makes further calculations and recommendations useless. If that is the case, but you want to trade again using this strategy, simply start over as if it's the first time you're using the strategy (enter whatever amount you like invested).
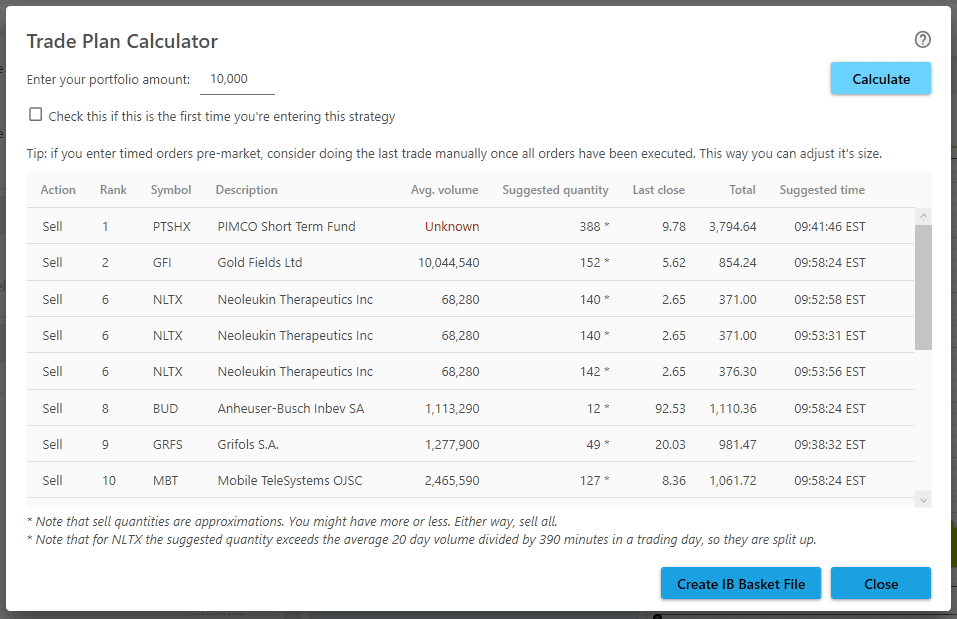
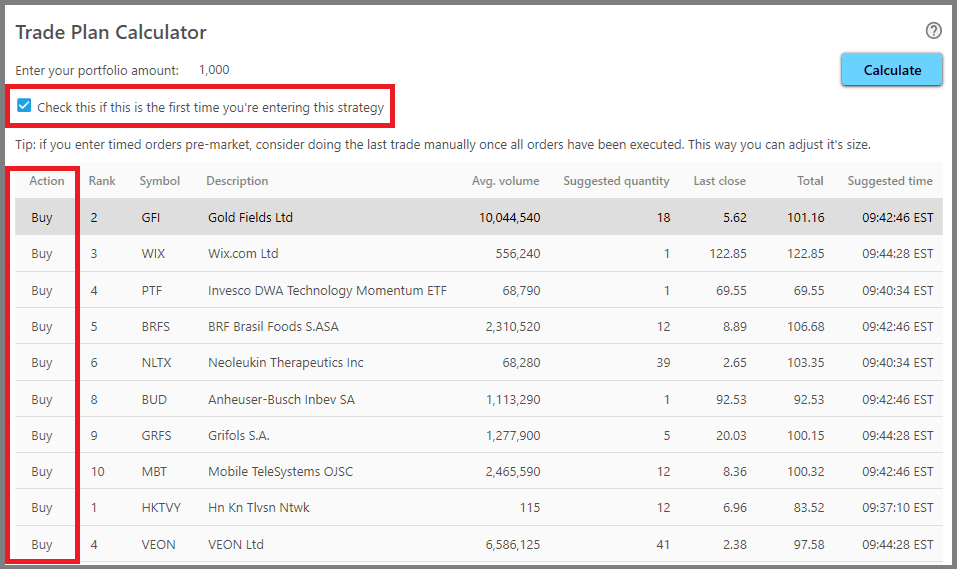
3. Once you clicked the “Calculate” button, the Trade Plan Calculator will be populated with data. On the “Symbol” and “Description” columns, you can see the instruments that you'll buy/sell.
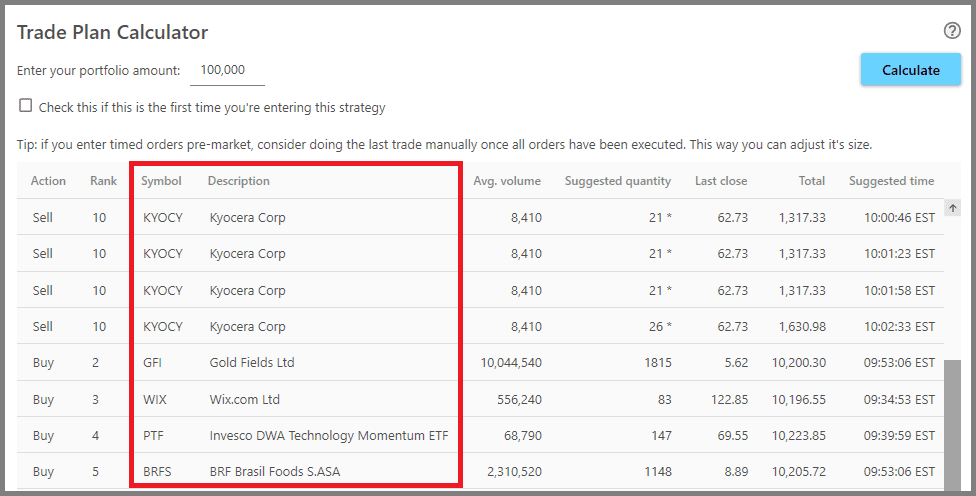
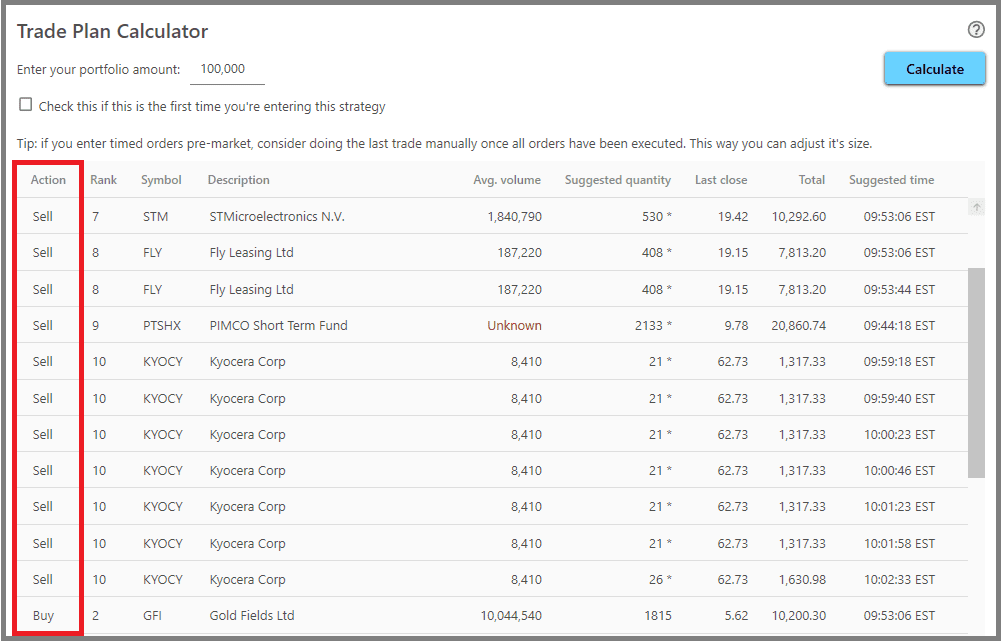
4. On the “Action” column, you can see what trade to take on a particular instrument, either Buy or Sell.
5. The “Suggested Quantity” column shows the amount of shares you need to buy/sell for each instrument.
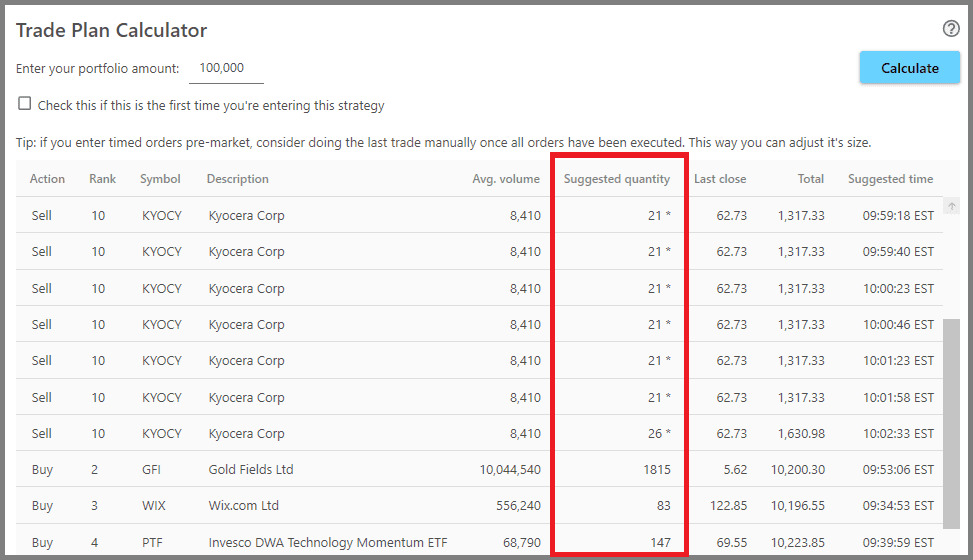
Note, the sell quantities are just approximations, you may have more or less of the suggested amount. But since we're liquidating the Position entirely, you need to sell all shares of that instrument.
6. The “Last Close” column shows the latest closing price for each instrument (in US dollar).
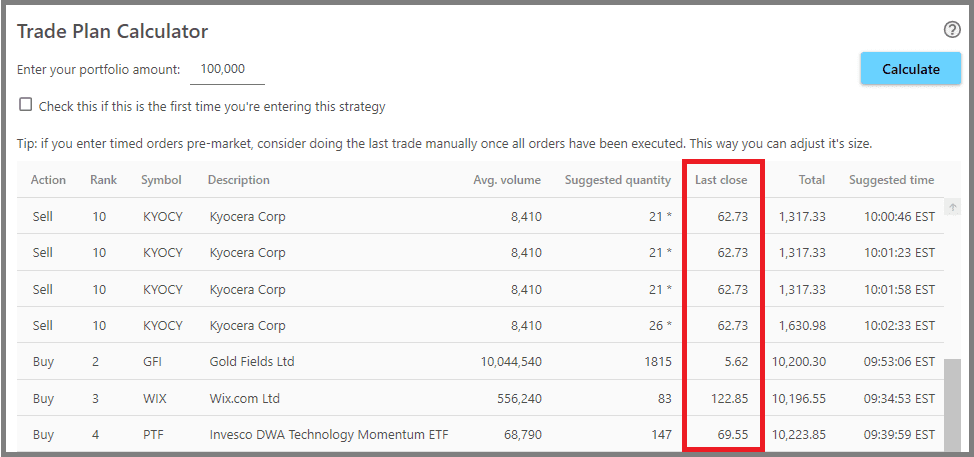
7. The “Total” column shows the amount of money involved for trading that instrument (if it's a Buy signal, you'll be expending money; if a Sell Signal, you'll receive money). This is calculated by multiplying the “suggested quantity” by the “last close”.

Note, each instrument's total fund conforms to its Position weight as shown in Positions Tab (relative to the other Positions), even if this is the first time you're using the Strategy at an arbitrary time (either periodic or continually switching Strategy). But, it may not exactly reflect the weight, due to the price per share that doesn't allow exact division. The total fund may be less than the weight, but not more.
8. The “Suggested Time” column shows the suggested time that your broker will execute these orders. The times are randomized within 30 minutes of the market open, and you can generate new randomized times by pressing the “Calculate” button again.

You don't need to pay special attention to these times, as they're merely suggestions. But if you're trading huge amount of shares, it's better to follow these suggestions, as they're able to obfuscate your trades from the High Frequency Traders, as well as avoiding slippage on your orders (bad fills).
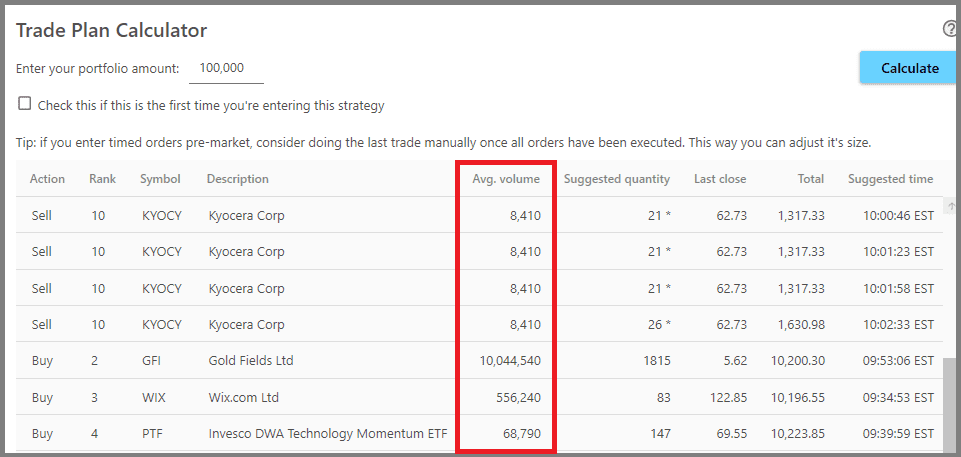
9. The “Avg. Volume” shows you the average traded volume (amount of shares traded) per day for each instrument.
10. The “Rank” column shows each instrument's rank based on the Ranking Rules.
![]()
11. If a Buy or Sell order exceeds the average traded volume per minute, the calculator will split that order into multiple smaller orders.
The average traded volume per minute is calculated (automatically) by dividing the “average daily volume” by “390 minutes” (which is how long a stock exchange opens in one day).
For example, you have a huge account and you'll be trading Kyocera Corp shares (KYOCY), which traded at an average of 8,140 shares per day, thus 21 shares per minute. If you were to trade 152 KYOCY shares in a single order, it won't be timely filled and you'll suffer slippage (there's no one to buy those extra shares).
Therefore, the calculator divides that big order into smaller orders with 21 shares each. You can see if your order is too big per minute, by looking at an instrument that's listed multiple times, with differently-timed orders.
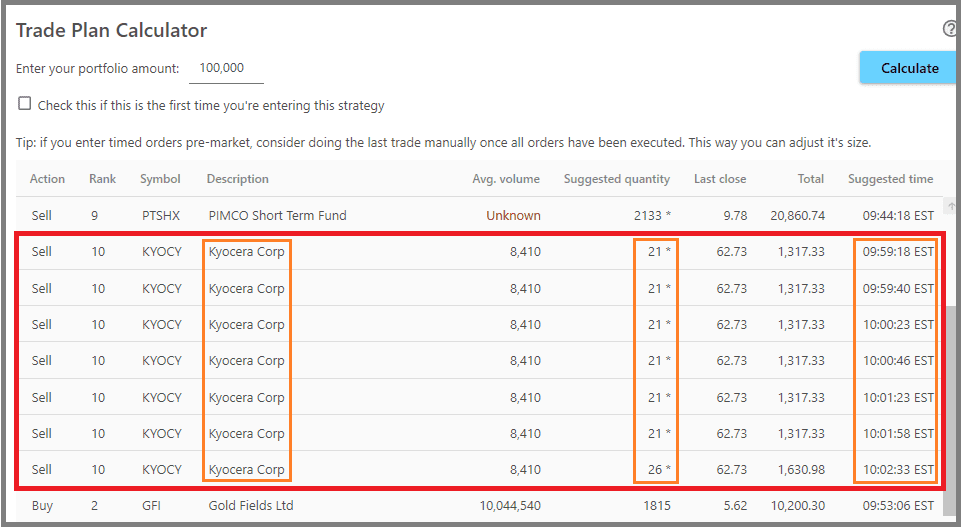
12. Now, if this is the first time you're putting this strategy for real use, you can enable the checkbox “Check this if this is the first time you're entering this strategy”, thus the Trade Plan Calculator will only tell you to buy into the various positions, as obviously you have none of the instruments to sell.
You don't need to wait for the switch day to use the strategy: you can use the Trade Plan Calculator to calculate your first Positions at any time, even if there are no trading signals.
Thus the calculator will recommend you to enter today's Positions as shown on the Positions Tab (as long as those Positions are not on the Sell Signals; if they are, then the calculator will recommend the next profitable Positions that will replace them, a.k.a. the Buy Signals).
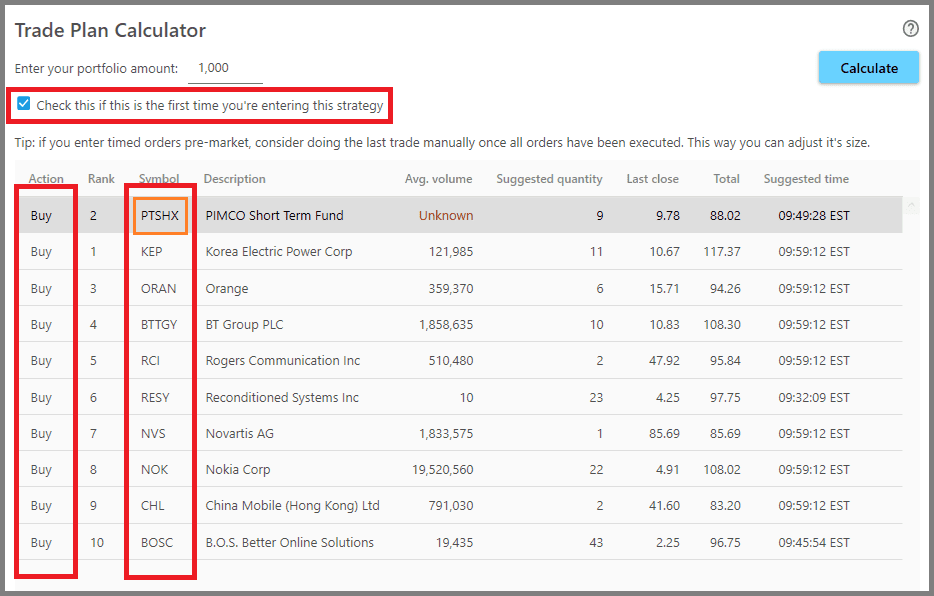
As shown in the picture above, a Position will be liquidated today (sold) and then replaced by the Cash Equivalent, but since it's the first time you use the strategy, you don't have that instrument to sell. So the calculator automatically tells you to buy the Cash Equivalent (PTSHX).
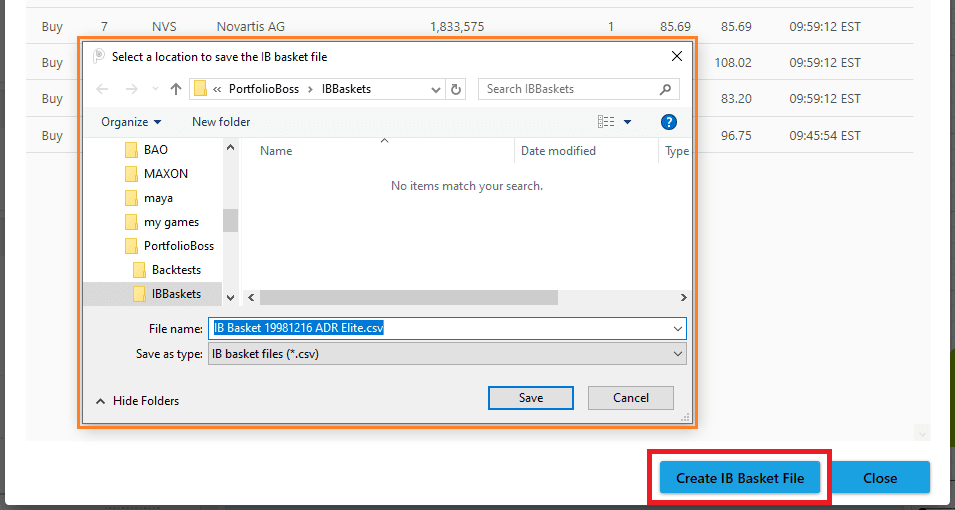
13. If you're using Interactive Brokers' TWS, it is now possible to enter your orders automatically into TWS (orders generated from this Trade Plan Calculator). To do that, while you're in this calculator, click the button “Create IB Basket File” which saves an IB Basket File.
So no longer do you need to type each order manually into TWS, which is error prone.
This basket file is then imported into TWS (Trader Workstation platform), and your orders are entered automatically with all the details, including the instruments' symbol, the number of shares, the stock exchanges to trade, the Limit Prices (if you're using Limit Orders in this strategy), etc. Please refer to the Trader Workstation's user guide here on how to import a Basket File.
Please note, this feature is only available in some licenses.
Notes:
- If you're trading a Multi-Strategy (or Meta-Strategy), the Trade Plan Calculator will merge trades of the same symbol (a symbol that belongs to different Positions, or even different strategies). For example, Strategy A will buy AAPL with 10% weight, and Strategy B will also buy AAPL but at 5% weight. These two trades will be merged into a single order amounting to 15% of your account size. Don't worry, the Multi-Strategy still keeps track of such different Positions.
- Due to the nature of Portfolio Boss' quick switching into new positions (once the old is liquidated), it's highly recommended that you use a Margin Account at your broker. If you use a Cash Account, your purchasing power may be limited by the Trade Settlement Date, or worse, you may commit Good Faith Violation (or Free Riding Violation) and get your account suspended. If, for whatever reason, you can't get a Margin Account, you must set aside some part of your fund (cash) as a reserve. It will be used to enter new positions recommended by PB while waiting for the previous trade's fund to settle.
- During switch day (or if you're using the strategy for the first time), your account size will be evenly divided to all new Positions that you'll buy. During non-switch day (when a Position hits a Sell Filter, or if you're using a continually-switching strategy), the amount of money used for buying the new Position depends on the old Position's “weight” as shown on the Positions Tab.
Discount Applied Successfully!
Your savings have been added to the cart.
Report
Block Member?
Please confirm you want to block this member.
You will no longer be able to:
- See blocked member's posts
- Mention this member in posts
- Invite this member to groups
- Message this member
- Add this member as a connection
Please note: This action will also remove this member from your connections and send a report to the site admin. Please allow a few minutes for this process to complete.
Report
