RSI Filter
This filter looks at an instrument's RSI (Relative Strength Index) during the past certain period, to decide whether that instrument will be bought/sold.
RSI is a momentum oscillator that indicates whether an instrument is being “overbought” (overpriced) or “oversold” (underpriced), thus it can tell you of an impending trend change.
RSI oscillates between 0% and 100%. Generally, an RSI of 70% or higher means the instrument is “overbought”, so it will experience a pullback or correction (however small or quick). An RSI of about 30% or less means the instrument is “oversold”, so it will experience a rally (however small or quick).
But these are just a general rule of thumb, since RSI may also generate false signals. So, it's best to use this filter with another filter, for example a moving average filter or the Primitive Pattern filter so you know what trend the instrument is currently at.
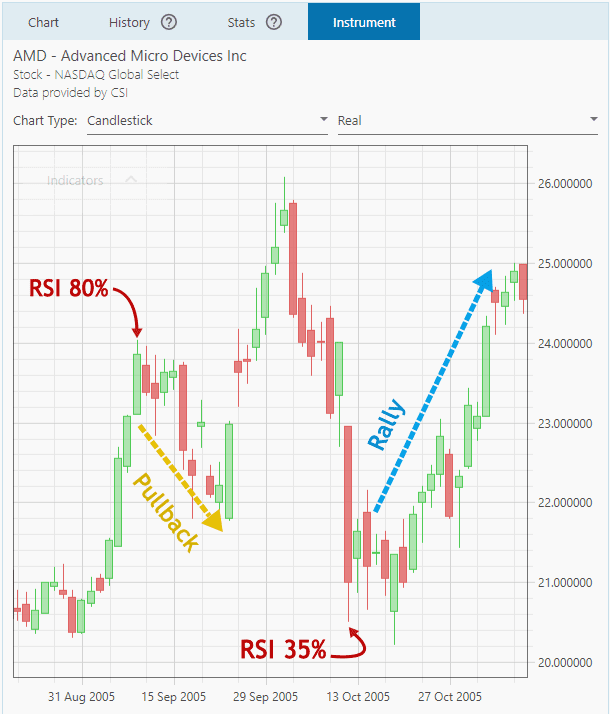
During an uptrend, an RSI of 30% or less usually signals a rally (after a pullback); whereas during a downtrend, an RSI of 70% or higher usually signals a reversal (after a peak). So, it's best to enter Positions whenever these instruments reach those RSI values.
Another school of thought uses the RSI as a trend confirmation: during an uptrend, the RSI may go above 70% for an extended period of time, whereas during a downtrend the RSI may go below 30% for an extended period.
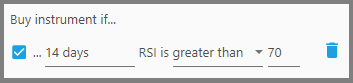
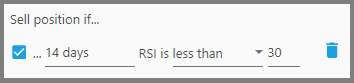
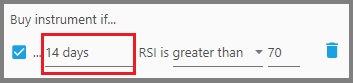
The parameters for this filter are:
1. The first parameter, “x days”, defines the period to look for the RSI, usually it is 14 days.
2. The second parameter, “Greater than/Less than/Between/Not between”, defines where the instrument's RSI must fall in relation to the threshold RSI, for that instrument to be considered.
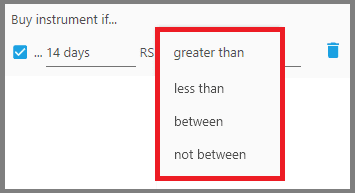
3. The third parameter, “n percent”, defines the threshold RSI that you want.
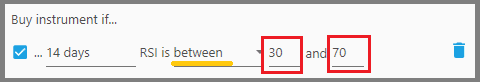
Generally, it's set at either 70% or 30%. But you can also set it at a maximum and minimum RSI values that you want, which means the instrument must fall between such RSI values, that is, if you use “Between” in the previous parameter.
If you use “Not Between”, you're looking for instruments whose RSI falls outside the minimum and maximum threshold.
Note:
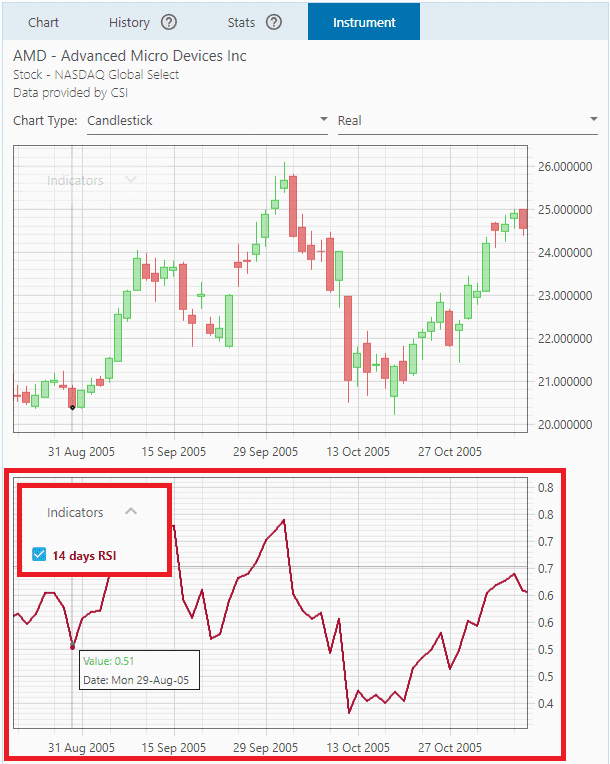
Using this filter will display an RSI indicator below the instrument's Price Chart. If it doesn't show up, hover your mouse just below the Price Chart until you see the cursor changes into a vertical arrow, then drag that edge upward so the RSI chart shows up entirely.
Discount Applied Successfully!
Your savings have been added to the cart.
Report
Block Member?
Please confirm you want to block this member.
You will no longer be able to:
- See blocked member's posts
- Mention this member in posts
- Invite this member to groups
- Message this member
- Add this member as a connection
Please note: This action will also remove this member from your connections and send a report to the site admin. Please allow a few minutes for this process to complete.
Report
