Chande Momentum Oscillator (CMO) Filter
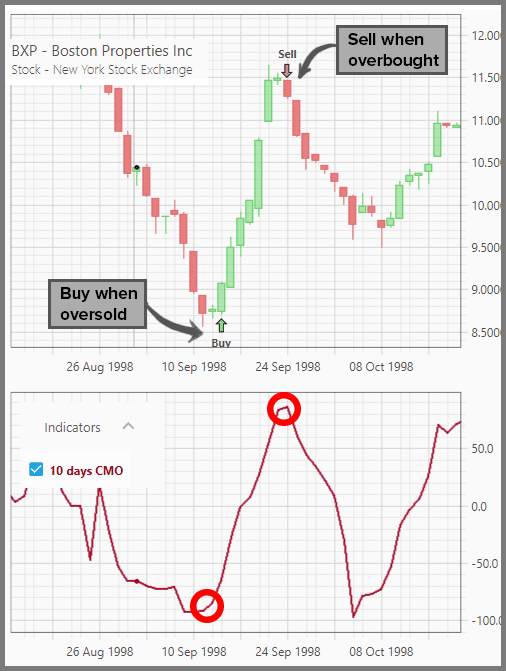
CMO filter allows you to detect over-bought and over-sold price levels, similar to the RSI filter. So, you buy when price is oversold (bears are exhausted), and sell when it's overbought (bulls are exhausted).
But there are three important differences with the RSI:
- CMO oscillates between -100 to 100. A wider scale means there's less chance the overbought-oversold readings are truncated. RSI on the other hand, has a narrower scale from 0 to 100. With intraday data, it's not uncommon to see extremely overbought instrument capped at 99 RSI, while actually it could be far more than that.
- This filter is more sensitive to the price action, since prices are not averaged as in RSI. Hence price will reach over-bought and over-sold levels more often, but not too often to result in false signals.
- CMO scale is symmetrical, thus more intuitive. The 0 level serves as the equilibrium. CMO reading above 0 means a positive price momentum (overbought at 50), while a reading below 0 means a negative momentum (oversold at -50). With RSI, the equilibrium level is not readily identifiable, thus harder to judge between an uptrend and a downtrend.
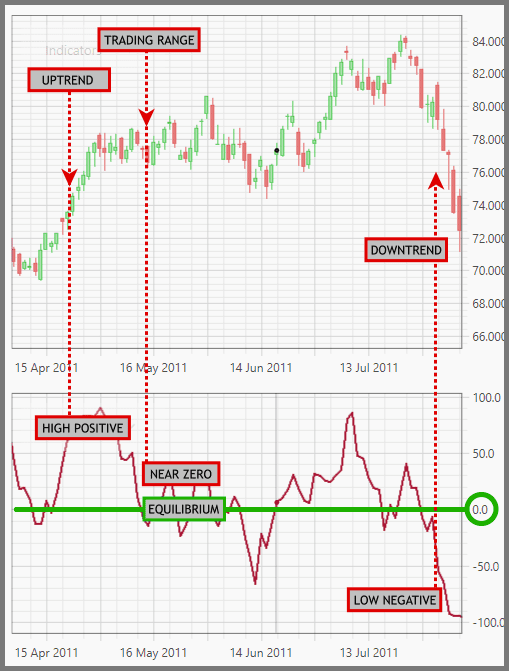
Therefore, as the third point tells us, CMO can also be used to identify a trend and its strength. A positive reading above 0 means that price gained during up days is more than the price lost during down days (up or down relative to the previous closing price), thus an uptrend. A negative reading below 0 means more price is lost during the down days, thus a downtrend. The closer the reading is to 0, the weaker the trend strength.
Now let's get to the filter's parameters:
1. The first parameter defines the CMO period.

The usual period is either 14 or 20 days, but we found the default of 10 days to be good overall. Let's say, with a period of 10 days, the filter looks at the price action from today to 10 days ago. It sees the total amount of the price gained during the up days, compared to the total amount lost during the down days, for the past 10 days.
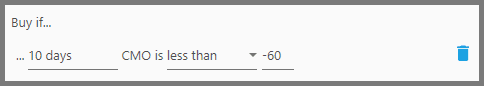
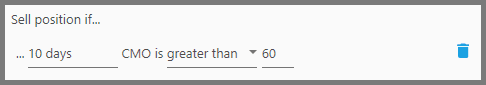
2. The second parameter defines where the instrument's CMO reading should fall in relation to the threshold CMO level.

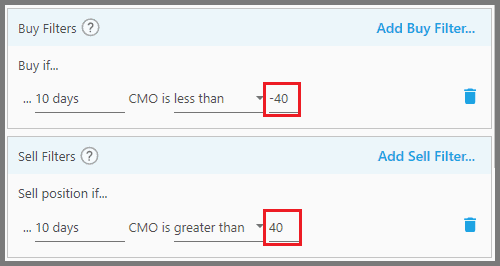
For example, you want to buy when the instrument's CMO reading falls below the oversold level of -50, you can set this parameter to “Less Than”. And if you want to sell when it exceeds the overbought level of 50, you set this to “Greater Than”.

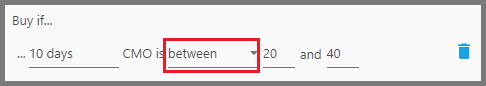
You can use “Between” to define a CMO zone that's neither too high nor too low. For example, to confirm it's a good uptrend you're buying (neither a weak trading range nor overbought), you set a buy filter to see whether the instrument's CMO level falls between 20 and 40:
3. The third parameter defines the threshold CMO level.
As stated previously, the overbought CMO threshold is usually at 50, while the oversold threshold is at -50. But any values between 40 to 70 (positive or negative) are good levels as well. Use 40 if you want to be cautious, not riding a trend for too long (exit before it's exhausted). Use 60 or 70 if you're confident the trend is so strong you want to squeeze the last drops of profit. But beware such extreme levels may not happen, and the price reverses deep instead.
Note:
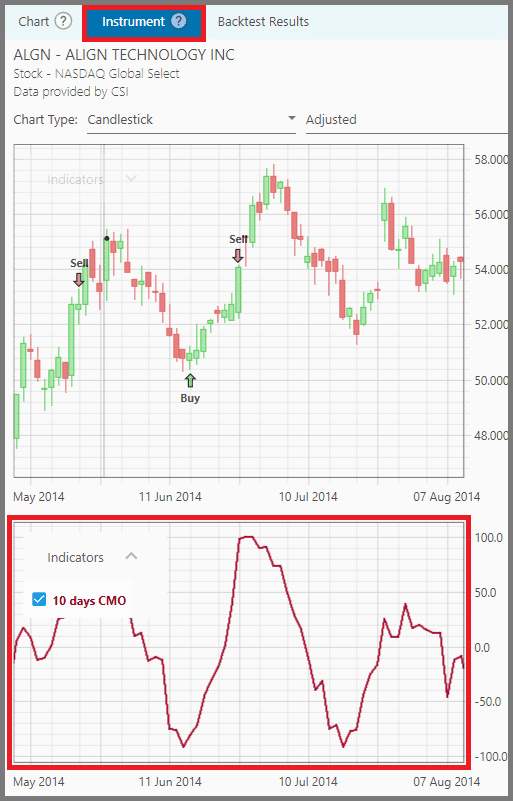
Once the filter is applied, the CMO indicator graph appears below the price chart (on the “Instrument” Tab). Make sure to backtest the strategy first, and select an instrument.
Discount Applied Successfully!
Your savings have been added to the cart.
Report
Block Member?
Please confirm you want to block this member.
You will no longer be able to:
- See blocked member's posts
- Mention this member in posts
- Invite this member to groups
- Message this member
- Add this member as a connection
Please note: This action will also remove this member from your connections and send a report to the site admin. Please allow a few minutes for this process to complete.
Report
