
DIVINE ENGINE · RESULTS WORKFLOW
Turn a long list of tests into a shortlist worth reviewing.
Filter your results, compare what the engine learned with what held up outside its training data, then open and save a candidate.
The Divine Engine Test Management page brings tests from your different strategy templates into one place. Use it to monitor the queue and review the strategies produced by those tests—including batches prepared with Strategy Mill. You do not need to open every template individually to find its results.
Before you begin: have a Divine Engine test queued, running, or completed. This walkthrough covers reviewing results. For setting up tests, see Design Strategies from Scratch and the Global Queue guide.
1. Find your way around the results page
Open Divine Engine Test Management from the left navigation—the stacked play-button icon. The page is arranged in three working areas, with the queue summary at the upper right.
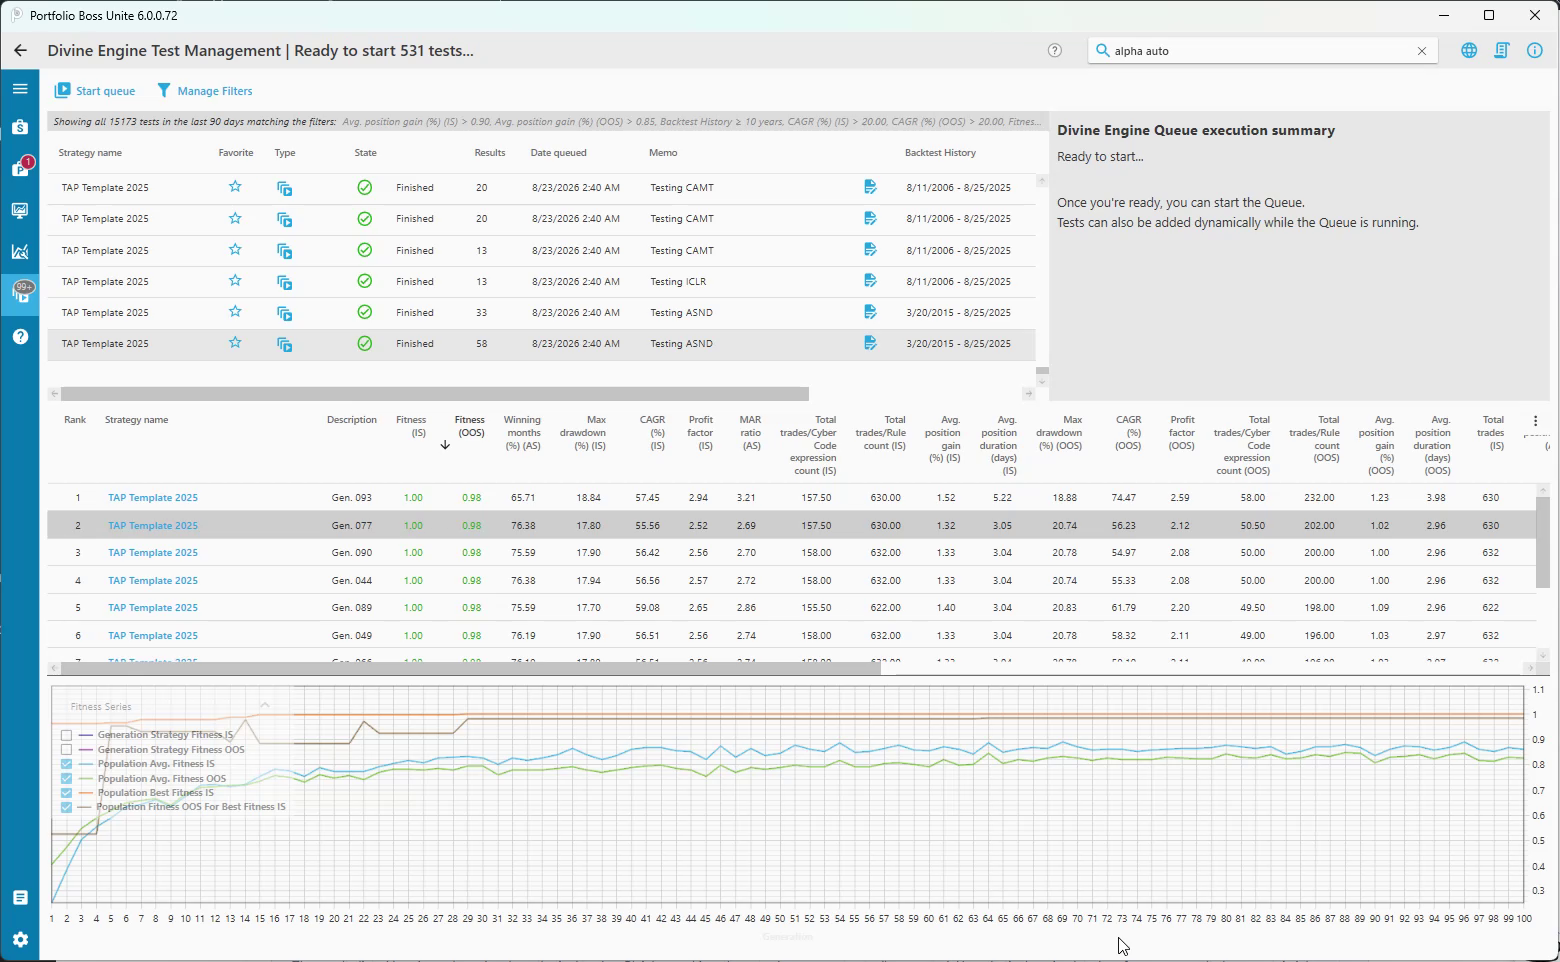
| Area | What to do here |
|---|---|
| Top: test list | Select a test run. Check its State, Results count, Date queued, Memo, and Backtest History. |
| Middle: strategy results | Compare the candidates produced by the selected test. Click a blue strategy name to inspect that result. |
| Bottom: Fitness Series | Check how fitness changed across generations and compare IS with OOS. |
| Upper right: queue summary | See the current test, current action, progress, and estimated remaining time. |
IS means in sample, the data used during strategy development. OOS means out of sample, the separate data used to check how the strategy behaved beyond that training sample. AS means all sample, the combined period. Keep these labels in view when comparing numbers.
2. Start with a filter set
Click Manage Filters near the upper left. Select Default (read-only) as your starting point. The dialog shows the metric, sample, comparison, and threshold for each filter.
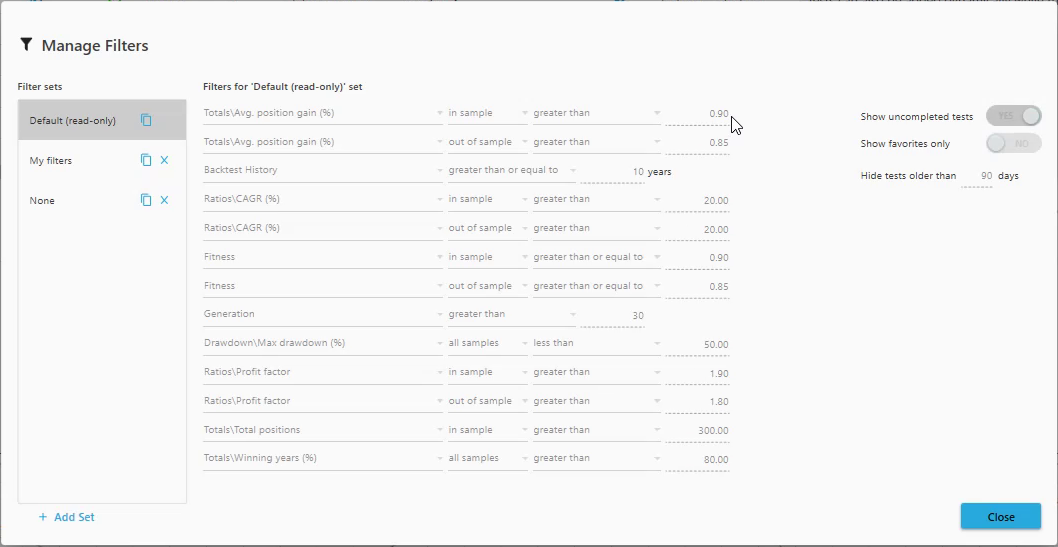
- Choose a set. The default set is read-only. To customize, use the copy icon beside a set or Add Set to create an editable set.
- Check the sample and operator. “Greater than” excludes equality; “greater than or equal to” includes it. IS, OOS, and all-sample conditions are different checks.
- Set the visibility controls. Use Show uncompleted tests, Show favorites only, and Hide tests older than to focus the list.
- Close the dialog and read the summary strip. The line above the test list reports the active filters and history window.
3. Understand the default thresholds
These are the exact comparisons visible in the Default (read-only) set in Dan’s November 6, 2026 recording. They are a starting screen for historical swing-trading results. Your installed version’s defaults may change.
| Metric | Sample | Passing value shown |
|---|---|---|
| Avg. position gain (%) | IS / OOS | > 0.90% / > 0.85% |
| Backtest History | Test history | ≥ 10 years |
| CAGR (%) | IS / OOS | > 20% / > 20% |
| Fitness | IS / OOS | ≥ 0.90 / ≥ 0.85 |
| Generation | Generation number | > 30 |
| Max drawdown (%) | All samples | < 50% |
| Profit factor | IS / OOS | > 1.90 / > 1.80 |
| Total positions | IS | > 300 |
| Winning years (%) | All samples | > 80% |
The default view also shows uncompleted tests, does not restrict the list to favorites, and hides tests older than 90 days. Those visibility settings are separate from the performance filters.
- Average position gain includes the losing positions. Dan wants enough average movement per position to leave room for trading costs—his reminder is to avoid “making the broker rich.” Check the costs used in the backtest as part of your review.
- History and position count provide context. Dan prefers a long record and many positions over a handful of impressive trades. Neither a 10-year history nor 300 positions proves that a strategy will keep working.
- Fitness combines the template’s objectives. It summarizes the configured fitness functions, normalized around their targets. A score near 1 is not a probability of future success. See Backtest Parameterization for how those objectives are defined.
- Profit factor is a ratio, not a percentage. A value of 2 means the historical winning-position gains were twice the losing-position losses. Enter 1.90 and 1.80 as ratios.
4. Add Dan’s refinements when you are ready
In part two, Dan switches to his editable My filters set. He narrows the test-age window to find recent runs and adds checks for simpler strategies. This personal set is different from the built-in default.
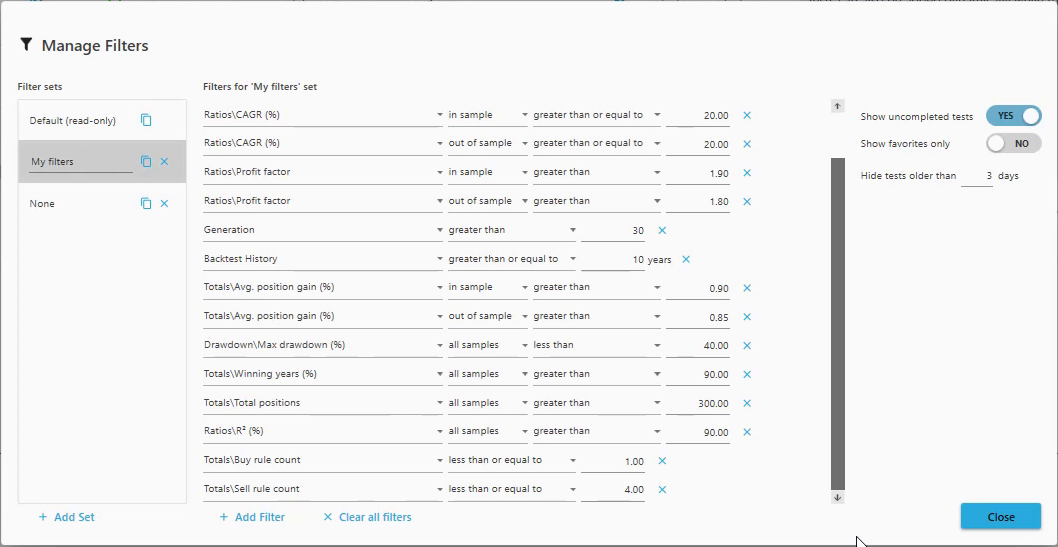
| Setting | Personal value shown |
|---|---|
| CAGR (%) — IS and OOS | ≥ 20% in each sample; this set includes equality. |
| Max drawdown (%) — all samples | < 40% |
| Winning years (%) — all samples | > 90% |
| Total positions — all samples | > 300; note the change from IS to all samples. |
| R² (%) — all samples | > 90% |
| Buy rule count / Sell rule count | ≤ 1 / ≤ 4 |
| Hide tests older than | 3 days in this walkthrough; widen it to find older runs. |
R² describes how closely the strategy’s equity curve follows a straight line on a logarithmic scale. It is a measure of fit, not a return percentage or a substitute for checking drawdown. See the R² explanation.
A strategy with few or no explicit Buy Filters can still have entry restrictions. In the setup Dan demonstrates, an active sell signal prevents buying that instrument. Inspect the System Settings and Sell Filters together to understand the actual entry and exit behavior.
5. Monitor the queue without guessing its finish time
Click Start queue to begin the queued tests. While it runs, the control becomes Stop queue. The execution summary shows the current test and action, a current-test progress bar, and total queue progress.
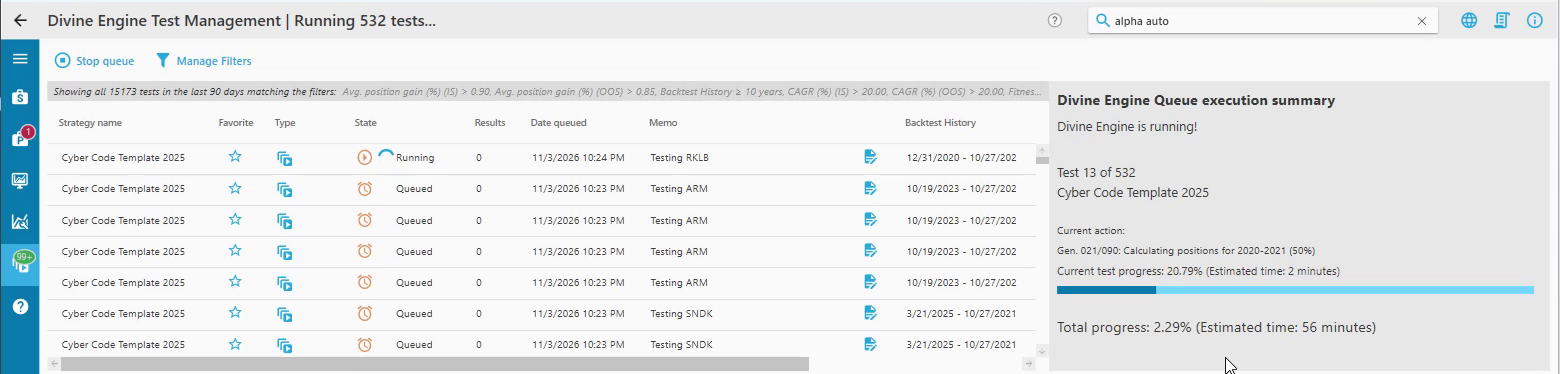
Treat the remaining time as an estimate. It can change as Portfolio Boss sees how long the work takes, especially early in a batch. Dan notes that large Strategy Mill batches may run for days; the actual time depends on the tests and the computer. See the Global Queue guide for queue setup and background operation.
Many templates include an exit condition that ends a run when improvement stalls. A plateau can therefore be the normal end of a test. The behavior depends on the template’s configured exit conditions.
6. Compare the candidates that remain
- Select a completed test in the upper list. Its candidate strategies appear in the middle grid.
- Sort by a useful metric. Dan clicks Fitness (OOS) to compare candidates on the verification sample. Check the sort direction.
- Read IS and OOS together. Review fitness alongside drawdown, average position gain, profit factor, history, and the number of positions.
- Check the exact dates. A recently created test can still end its market-data history years ago. The recording’s AAPL/TLT example ends in 2021.
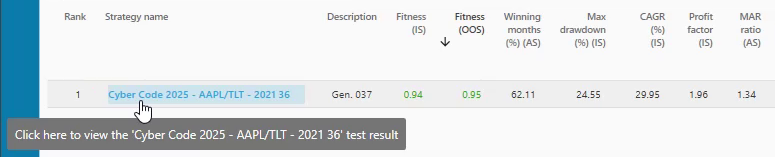
The green check in the upper list accompanies the Finished state. It tells you the run has finished; it is not approval to trade. Use the active filters and the candidate’s metrics to judge what deserves a closer look.
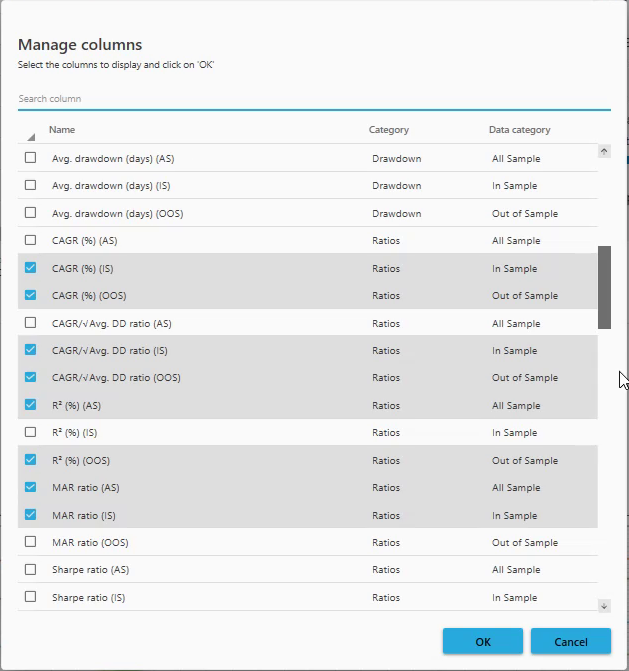
To customize the grid, click the small three-dot column control at its upper-right edge. In Manage columns, search for a metric, check the IS, OOS, or AS versions you want, and click OK. Uncheck columns you do not need. Use the horizontal scrollbar to reach columns farther right.
7. Read the Fitness Series chart in pairs
The horizontal axis is the generation number. The vertical axis is fitness. Start with the four lines below; the checkboxes in the legend let you show or hide a series.

| Series in the legend | What it shows |
|---|---|
| Orange — Population Best Fitness IS | The best in-sample fitness in each population. |
| Brown — Population Fitness OOS For Best Fitness IS | The out-of-sample fitness of that same best-IS strategy—not a separately selected OOS winner. |
| Blue/cyan — Population Avg. Fitness IS | The population’s average in-sample fitness. |
| Green — Population Avg. Fitness OOS | The population’s average out-of-sample fitness. |
Dan looks for improving population averages and a reasonably close relationship between the orange and brown lines, especially later in the run. If the best IS result improves while its OOS result falls away, investigate the gap. Read the vertical scale as well as the apparent distance between the lines.
Right-click in the chart and move the pointer to inspect the values shown in the chart readout. Remember that this is a fitness history across generations, not the strategy’s account-value chart over calendar time.
8. Open, review, and save a strategy
Click a candidate’s blue Strategy name in the middle grid. Portfolio Boss opens Strategy Builder with the heading Viewing test result. This is a temporary working view: opening it has not yet saved a regular strategy.
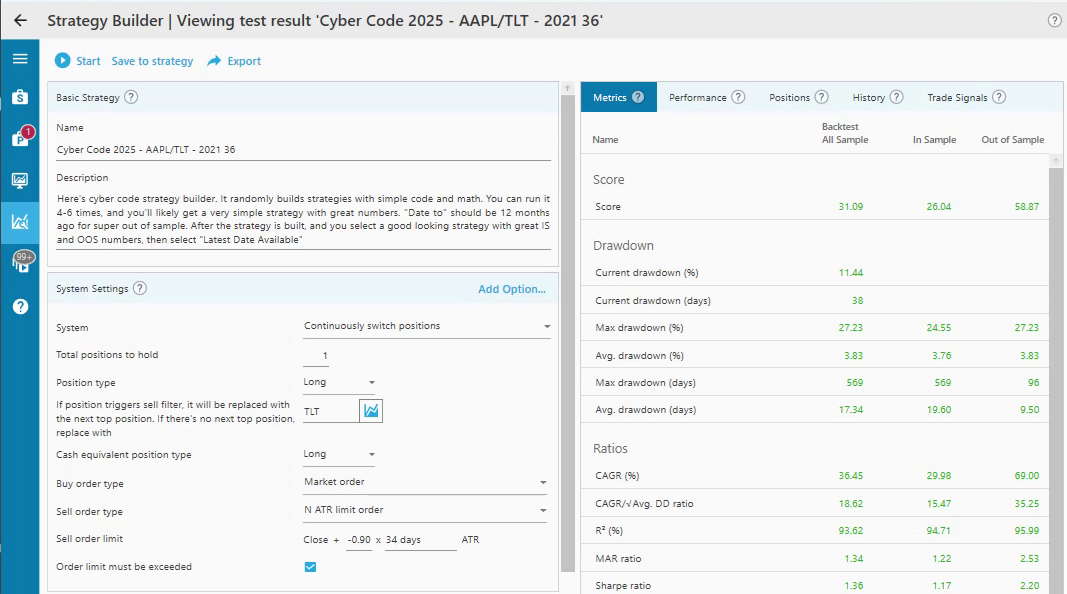
- Review the template description, rules, instruments, and dates. Understand what the candidate actually does.
- Click Start to run the backtest in Strategy Builder and inspect the Metrics, Performance, and Chart views. Keep IS and OOS results visible during review.
- Click Save to strategy. In the dialog, choose the destination under Create in and review the Name.
- Click Save to strategy inside the dialog to finish saving. Opening the dialog alone does not save it.
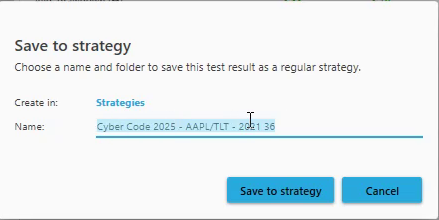
Templates can supply naming rules. In Dan’s example, the suggested name identifies the template, the AAPL/TLT instruments, and information from the test. These names depend on the template; you can edit the suggested name before saving.
If something looks wrong
| What you see | What to check |
|---|---|
| No candidates, or fewer results than expected | Check the selected filter set, every sample/comparison, Show favorites only, and the age window. Select a completed test with results. |
| Older tests have disappeared | Increase Hide tests older than. This visibility setting does not shorten the market-data history used by a backtest. |
| Unfinished tests are missing | Check Show uncompleted tests in Manage Filters. |
| A metric is missing | Open Manage columns, select the desired sample version, and scroll the grid horizontally. |
| A strategy has no explicit Buy Filters | Inspect its System Settings and Sell Filters. The demonstrated setup prevents entry while a sell signal is active. |
| The result is not a regular saved strategy yet | A Viewing test result heading means you are reviewing a temporary result. Complete Save to strategy and its dialog. |
Continue learning: Fitness functions and exit conditions · Metric definitions · Combining strategies.
Based on Dan’s two walkthrough recordings from November 6, 2026, using Portfolio Boss Unite 6.0.0.72. Screenshots show historical examples; names, results, and defaults may differ in your installation. Back to the walkthrough.


Responses