Backtest Parameterization Panel

This panel defines how the Divine Engine backtest is performed. But most importantly, it allows you to tell the Divine Engine the criteria you want in the strategies it produced. This panel shows up only when the Divine Engine is enabled.
Behind the scene, there are so many things going on in this panel. In this guide, we'll explore every concept thoroughly. We'll discuss how exactly the Evolutionary progression is performed, the tournaments, the cross-breeding and mutation, the rotational fitness, the calculation of fitness score, and many more.
This page is divided into four segments:
Here's the full list of properties contained in this panel (top to bottom, based on how they appear):
- Search Algorithm
- Population Size
- Cross-breeding Rate
- Mutation Rate
- Min. Generations
- Max. Generations
- Execute N Random Backtests…
- Number of Parameter Steps
- Number of Parameter Combinations
- Tournament Type
- Tournament Fitness Function Rotation
- Rule Set Parameterization
- Randomize Ranking Rule Offsets
- Use Current Rule Set as Baseline
- Fitness Function
- Exit Conditions
- Average In-Sample Population Fitness Rate of Change Exit Condition
- In-Sample/Out-of-Sample Moving Average Rate of Change Divergence Exit Condition
- Moving Average In-Sample Population Fitness Exit Condition
- Moving Average Out-of-Sample Population Fitness Exit Condition
- No New High for Out-of-Sample Moving Average Exit Condition
It's highly recommended that you familiarize yourself first with the Divine Engine and The Boss by following the tutorials here.
Note this is a huge page, so if some images don't show up, please refresh/reload the page.
Evolutionary
1. Search Algorithm – This is the most important property, as it defines the search algorithm used by the Divine Engine.

This property fundamentally changes how the Divine Engine works in finding the best strategies. With “Evolutionary” algorithm, the Divine Engine utilizes the Evolutionary progression to create higher performing strategies: it builds up from earlier, lower-performing strategies as the foundation. Whereas the “Random” algorithm lets the Divine Engine to employ brute force to achieve its goal.

By changing this property you change most properties on the Backtest Parameterization panel, to conform with the search mode you selected. Therefore we'll start with the Evolutionary mode and discuss the properties related to it.

Evolutionary mode is best suited to create strategies from scratch, or to augment an existing strategy with new rules and filters.
2. Population Size – This property defines the amount of strategies contained within each generation.

Let us discuss first what happens at the beginning of the evolution: the Divine Engine populates the 1st Generation with diverse strategies. In the screenshot above, for example, it creates 64 different strategies.
There are two ways to do this: if you start from scratch without supplying any rules and filters, the Divine Engine adds random rules and filters (along with their random values) for each one of the 64 strategies. On the other hand, if you have an existing strategy, the Divine Engine creates other strategies as variations of your “baseline” strategy.
Such variations may come from:
- Your parameterizations, thus other strategies contain the same rules you supplied but with different values (specified within your parameterization range).
- The rules you set to “Replaceable” (or “Random”), thus some strategies contain those rules, while others don't.
- And finally, variations may come from the fresh new filters added by the Divine Engine itself. Thus one strategy contains the filters A, B, C, while another strategy contains X, Y, Z.


Notice, the value you set on “Population Size” must be a multiple of 4. This is due to the tournament mechanism that requires 4 strategies to do battle (will be explained later). Also, it's best to set “Population Size” to a smaller value, like 64 or 128, and then do multiple Divine Engine backtests simultaneously.
We've found that a smaller Population Size may increase the likelihood of finding better performing strategies, in contrast to a large bunch of population at once (like 256). By doing multiple backtests with smaller Population Size, you can simulate “the island effect”: an evolutionary idea where different groups of people (or organisms) develop independently of each other, without being dragged down by the others' “bad gene” or fierce competition.
Then, to find the best 20 strategies from the multiple backtests, take a look at the Overall Top Results Tab:

Notes:
- The Population Size represents the amount of CPU cores utilized by the Divine Engine. Thus with 64 size, you'll consume 64 CPU cores at any given time, with each strategy consuming 1 CPU core. If you have 3 simultaneous backtests, it follows that 192 cores will be used.
- Thus a larger Population Size will increase backtest time, if CPU cores in the cloud are currently shared with other users. Therefore a smaller size will get you the best of both worlds.
- When the Divine Engine adds the new filters, there are limits: the amount of Buy, Ranking, or Sell Filters is each capped at 10 per strategy, including the ones you add yourself. Thus the Divine Engine won't add new filters if there's no room for them. Strategies often contain less than these limits, unless you fill it to the brim with your own filters/rules. If you exceed the limit, the filters set to “Replaceable” may get removed until such a limit is respected again. Those filters you set to “Not Replaceable” will stay no matter what, even if they exceed the limit.
3. Cross-breeding Rate – This property defines the percentage of offspring created through cross-breeding (sex between parent strategies). Or put another way, it defines the amount of parent strategies that are willing to marry.

But we haven't discussed what happens after the 1st Generation was created. So let's continue our Evolutionary discussion: after the 1st Generation was created, these 64 strategies are backtested to find their Metrics' values. Therefore each strategy has their Score, CAGR, Drawdown, MAR, Sharpe, and other Metrics reported.
Once done, they'll do the tournaments to define the survival of the fittest. Each tournament consists of 4 strategies battling each other. These 4 strategies are pulled randomly from the pool of 64. Therefore with a Population Size of 64, we'll have 16 tournaments.
During the tournament, the 4 strategies are sorted top to bottom based on the Fitness Function criteria that you set. For example, if you used CAGR as the Fitness Function, the 4 strategies are sorted based on their CAGR values. The top two strategies with the highest CAGR are kept as survivors, while the bottom two are destroyed. The tournament repeats for other strategies until the pool is empty, and we're left with the 32 survivors. The pair of strategies that survived each tournament will become parents for their offspring.
These 32 survivors are now part of the 2nd Generation. The Divine Engine will then “repopulate” this Generation with their offspring. This is when each pair (the two survivors of each tournament) cross-breed. But not all parents will cross-breed; some choose to simply clone themselves to produce their offspring. This parameter “Cross-Breeding Rate” defines what percentage of parents will cross-breed, and the rest will simply clone themselves.
For example, with a “Cross-Breeding Rate” of 80%, there will be 80% of survivors to cross-breed, while 20% will clone themselves. Regardless, every pair will create another pair of offspring. Thus 32 survivors will produce exactly 32 offspring, replenishing the Population Size to its original 64 size.
Now, what happens exactly during cross-breeding? Cross-breeding essentially means: the two parent strategies pooled their respective rules together, and the children are given random rules picked from that pool. For more clarity, take a look at these illustrations:
As you can see above, cross-breeding happens in all System Settings, Buy Filters, Ranking, and Sell Filters panels. For the System Settings panel, children are given random rules (picked from the parents' System Settings pool) until their System Settings panel is entirely populated & valid.
For the Buy Filters panel, children are also given filters picked randomly from the parents' Buy Filters pool. The amount they're given is anywhere from the 1st Parent's amount to the 2nd Parent's amount. Let's say the 1st Parent contains 3 Buy Filters, while the 2nd Parent has 5 Buy Filters. A child therefore may contain 3, 4, or 5 Buy Filters. The Sell Filters and Ranking Rules have the same mechanism. Note, a child is not allowed duplicate rules, i.e two rules with the exact same type and values.
This mechanism is further influenced by the Mutation Rate, that is, with a higher mutation, a child is more likely to get a different amount of rules than its parents. Continuing with the example above, instead of a random amount between 3 and 5 filters, the child may be assigned anything from 1 to 10 amount of filters (if you use a high mutation rate, that is). In other words, the range is extended by decreasing the lower bound (3), and increasing the upper bound (5). It is so, because with higher mutation we want the offspring to be more different than their parents. And since the parents have only 8 distinct rules between them (3 and 5), should the child be given more than 8 slots, it will be capped at 8.
Essentially, cross-breeding is not about modifying the rules' values, but simply plucking random rules from the parents. A lower Cross-Breed rate means cloning is more prevalent. This may negatively affect the Evolutionary progression as strategies have less variations between them, thus little or no performance growth throughout the generations.
Notes:
- The tournaments do not actually use the Metric's actual value (e.g CAGR's percentage), but rather that Metric's value normalized into a factor of 1. This is the “Fitness Score” that serves as the basis for the tournament. If you have multiple Fitness Functions, the Metrics' values are combined and normalized as well. We'll discuss about this later.
- The Fitness Score is calculated from the Metric's performance during the In-Sample period. This is deliberate so that the Divine Engine is “blind” and does not overfit the Out-of-Sample period as well.
- During cross-breeding, a user-supplied rule that's set to “Not Replaceable” (or “Enabled”) will always be part of the children, regardless of its current form due to Parameterization.
4. Mutation Rate – This property defines the percent chance that a “randomizable thing” will be randomized again.

You may wonder, what's a “randomizable thing”? To answer that question, let's continue with our Evolutionary discussion: after the offspring are created (through cross-breeding and cloning), they'll undergo the mutation phase. That is, mutation does not happen for the parent strategies.
During mutation, a strategy's “randomizable things” may become randomized again. Such “randomizable things” include:
- Parameters which are parameterized by you. For example, you supplied a filter “Simple Moving Average (SMA) Position” and parameterized the period parameter, with a range of 10 to 300 days and a step of 10 days. The Divine Engine may then “randomize” that period parameter again, picking a value that falls within 10 to 300 days with a step of 10 days. If a parameter is not parameterized, it will stay no matter what with the value you set.

- Rules that are set to “Replaceable” or “Random”. For example, you supplied your own “RSI Filter” and flagged it as “Replaceable”. Then it may be replaced with another rule picked randomly by the Divine Engine (with its random values as well).

- Rules added by the Divine Engine (not you!) have the flag “Replaceable” automatically set to it. Thus the entire rule may get replaced by another rule.

- All parameters of a rule added by the Divine Engine. So, a rule added by the Divine Engine not only has the “Replaceable” flag set, but all its parameters may get “randomized” again based on the Divine Engine's own parameterization ranges.

So in essence, each of those “randomizable things” takes a dice roll on whether it will be randomized again. A higher “Mutation Rate” means there's a higher chance that it will get mutated to obtain a new value (or a new rule). Hence more variation in the rules & values between strategies (diverse gene).
Be careful if you set the “Mutation Rate” too high: the Evolution may not be able to build from the previous generations, as the “DNA” is wrecked and replaced by new ones completely different from the parents.
5. Min. Generations – This property defines the minimum amount of Generations the Divine Engine will create.

We're at the full 2nd Generation now, let's continue where we left off: After the offspring are created through cross-breeding, cloning, and subsequently mutated, they will be backtested to find their Metrics' performance. This is similar to what happened previously (in the 1st Generation), except that now only the offspring are backtested. Parent strategies obviously have been backtested in the 1st Generation, so we don't need to check their Metrics' performance again.
Then all strategies within this 2nd Generation, parents and offspring alike, do battle between each other. The tournaments happen again with the exact same mechanism as already described. The survivors then become parents for the 3rd Generation, and these parents cross-breed and clone themselves to produce offspring in the 3rd Generation. Offsprings are then mutated, and the whole 3rd Generation do tournaments all over again. This cycle continues for at least the “Min. Generations” that you set here.
Therefore “Min. Generations” is the absolute minimum amount of generations that the Divine Engine creates, no matter what. Let's say you set it to 20, then 20 Generations it will be.
The larger the “Min. Generations”, the longer the backtest time will be.
6. Max. Generations – This property defines the absolute maximum amount of generations (that may or may not be created).

After the “Min. Generations” are created (in our example 20 Generations) then the Exit Conditions kick in. We'll explain about them in a moment. But essentially, they're the criteria for stopping the Evolutionary progression should it only produce lower and lower performing strategies. Like a hawk, they watch each generation's performance, deciding whether or not the Evolution must be stopped. For example, if at the 20th Generation the Exit Conditions are hit, there'll be no more tournaments, no more cross-breeding, cloning, and mutation. There will be no 21st Generation.
Conversely, if none of the Exit Conditions are hit, the cycle continues until the “Max. Generations”. Let's say you set it to 70, then 70 Generations will be created. That's the absolute maximum. There will be no more after that. The cycle stops no matter what.
A higher “Max. Generations” mean a longer backtest time. But the Evolution could mature enough with such a longer “timeline”, and you'll be rewarded with high-performing strategies. But sometimes, a longer “timeline” is a waste of compute power if subsequent generations only yield lower (or at least the same) performing strategies over and over again. That's the reason you use Exit Conditions. If you don't use Exit Conditions at all, the Divine Engine will always create strategies up to the “Max. Generations” that you specified.
7. Exit Conditions – This section of the Backtest Parameterization Panel allows you to add and customize the Exit Conditions.

So we've touched the general idea of Exit Conditions. We'll get into the details, but first we must finish our Evolutionary discussion. We'll discuss the concept of “Average Fitness Score”, and how the top strategies are picked:
The 1st Generation contains a set of population, let's say 64 strategies; and each strategy has its own Fitness Score. If you use CAGR as the Fitness Function, then each strategy's Fitness Score is calculated from the in-sample CAGR. This CAGR value is then normalized into a factor of 1, to yield the final Fitness Score.
The Divine Engine then calculates the average of the Fitness Score from those 64 strategies. This is the “Average Fitness Score” of the 1st Generation. In addition, the strategy with the highest Fitness Score is recorded as one of the “Top Strategies”, which you'll eventually see at the Divine Engine Results Tab.
This process (of finding the Average Fitness Score and the Top Strategy) continues for subsequent generations. From the 2nd Generation onward, the top strategy that's picked is the best strategy from each Generation's offspring.
That's because the 1st Generation's top strategy, being a survivor and a top parent, will always be the top strategy of the next generations unless there's an offspring strategy that can beat it. So the Divine Engine continually watches (and picks) the best offspring of each Generation, to see if they can beat the old man.
When the Evolution reaches its end, the Divine Engine picks 20 (or less) high-performing strategies from the last Generation, not just the Top Strategy there. It's so that results from the ultimate terminus of the Evolutionary progression are not wasted, based on the idea that the last Generation should benefit from all Generations behind it.
Thus our Evolutionary discussion ends, with the Top Strategies served to you. Now you may wonder, what use is the “Average Fitness Score” then? Well it serves as the input for the Exit Conditions, and we'll get to it as we explain each Exit Condition.
So let's see what types of Exit Condition we have, by clicking the button Add Exit Condition:

That opens a dialog, where you see we have four different Exit Conditions:

- Average In-Sample Population Fitness Rate of Change
- In-Sample/Out-of-Sample Moving Average Rate of Change Divergence
- Moving Average In-Sample Population Fitness
- Moving Average Out-of-Sample Population Fitness
- No New High for Out of Sample Moving Average (this is the default Exit Condition)
Select any of those Exit Conditions (by ticking their checkbox), and press OK to add them.
Average In-Sample Population Fitness Rate of Change:

This Exit Condition stops the evolution if the Average Fitness Score drops (across many generations) below the threshold Rate of Change that you specified here.
Do you recall the Average Fitness Score we discussed earlier? This Exit Condition tracks the percentage change (also known as the Rate of Change) of the latest Generation's “Average Fitness Score” and the “Average Fitness Score” of N Generations ago. Let's say the Evolutionary progression is currently at Generation 25, and its “Average Fitness Score” is 0.70. We look back ten generations (including the current generation), that's Generation 16, and its “Average Fitness Score” is 1.5. Thus from Generation 16 to 25 we have a drop of -53%. Such a large drop warrants the termination of the Evolutionary progression.

The first parameter defines the “period”, so to speak, for the Rate of Change. So if you set it to 10, the Exit Condition looks back “10 generations”, including the latest Generation. Obviously this is a moving window, so if we're currently at Generation 25, then it looks back at Generation 16. And if the Exit Condition is not met, the Divine Engine creates the Generation 26, thus we look back at Generation 17, and so on and so forth.
It is best to set a longer “period” here, so the Exit Condition is more forgiving (wider tolerance). If you set a shorter period, thus a tighter “window”, you'll get stopped out all the time as extreme fluctuations usually happen in the short term. It may reduce the chance of finding better performing strategies as the Evolutionary progression hasn't matured enough.

The second parameter defines the threshold Rate of Change (in percent). If the RoC (Rate of Change) across 10 generations falls below this threshold RoC (the percentage change is less than this threshold), the Exit Condition is hit and the Evolution stopped. Usually, we want to set this parameter at either 0%, or a big negative percentage (let's say -50%). The former indicates that we only want a “generally increasing” Fitness Score to happen instead of a decline; even if there are declines, we hope they happen for only a few generations, not a long term decline. The latter (-50%) is actually more useful, as the Evolution won't be stopped unless there's extreme RoC drop, in which case the next generations are more likely to be losers.
We don't want this parameter set to a high RoC, as that means we don't tolerate the little gradual changes (even the little negative changes) inevitable in an Evolutionary progression. High RoC is not sustainable in the long run: as the Evolution can't keep up with such a high standard, it may get stopped prematurely. Remember that this is an Exit Condition, whose sole purpose is to stop a bad Evolution, not as a fitness criteria that you want in a strategy.
In-Sample/Out-of-Sample Moving Average Rate of Change Divergence:

Quite an intimidating name for this Exit Condition, and rightfully so, as it's a combination of five concepts:
- the “Average Fitness Score” in-sample,
- the “Average Fitness Score” out-of-sample,
- the “N generations Moving Average” for those two “Average Fitness Score” above,
- the “N generations Rate of Change” for each of the Moving Averages above, and finally
- the delta (a.k.a divergence) between those two Rates of Change.
- First, the “Average Fitness Score” in-sample, we've already discussed about this extensively.
- Second, the “Average Fitness Score” out-of-sample, is similar to the previous one, except the Metric's performance is taken during the out-of-sample period.
- Third, the “N generations Moving Average”, plots a Moving Average line for the “Average Fitness Score” across the generations. It's similar to the Moving Average of stock prices, but here the “price” is replaced with each generation's “Average Fitness Score”. And instead of “N days” as the Moving Average period, we use “N generations”. The Moving Average is plotted for each of the in-sample and out-of-sample “Average Fitness Score” graphs.
- Fourth, the “N generations Rate of Change”, calculates the percent difference (Rate of Change) between the latest generation's Moving Average value and the Moving Average value N generations back. This is also done for each of the in-sample and out-of-sample “Average Fitness Score” graphs. Thus we have two Moving Average RoCs: one for the in-sample performance, another for the out-of-sample performance.
- Finally, find the difference (subtract) these two RoCs, to yield the “RoC Divergence”.
The idea here is to stop the Evolutionary search if there's great inconsistency (great divergence) between the in-sample performance and the out-of-sample performance throughout the generations. That is, in-sample “Average Fitness Score” only increases throughout generations, while the out-of-sample “Average Fitness Score” (for the exact same strategies) only decreases throughout the generations. If we continue the Evolution, the Divine Engine may yield top performing strategies indeed, but only for the in-sample period. The out-of-sample performance, on the other hand, is underwhelming. We don't want such inconsistent strategies, as their backtest performance may as well be fake, and you may lose your hard-earned money investing in them. Note, such inconsistency (great divergence) may also apply if the out-of-sample performance is much greater than the in-sample.

The first parameter defines the “period” for both the Moving Average and the Rate of Change. If you set it to 10, for example, there are 10 generations' worth of “Average Fitness Score” that will be smoothed-out to produce the Moving Average. Ditto the Rate of Change compares the Moving Average that spans 10 generations.
You may wonder why are we using Moving Average instead of the Average Fitness Score themselves? The answer is that a Moving Average gives you a more objective view for the long term progression, so the Rate of Change won't get whipsawed by outlier Average Fitness Score (spike up/down) that usually happens short-term.
It's recommended to use a longer “period” for this parameter, so the Evolution won't be stopped prematurely due to such extreme outlier values. Remember this is an Exit Condition, and we don't want the Evolution to be stopped, unless there's a chronic (long term) divergence.

The second parameter defines the threshold divergence (a.k.a. difference, or delta) between the in-sample RoC and the out-of-sample RoC. Let's say we put this threshold at 50%, and the former RoC is 30% while the latter RoC is -40%, thus a delta of 30% – (-40%) = 70%. That's a large divergence, much greater than our threshold at 50%, so the Evolution is stopped, as future generations may only yield greater inconsistency between the in-sample and out-of-sample performances.
Preferably, set this threshold at a higher percentage, so the Evolution won't get stopped by temporary small divergences that are bound to happen.
Moving Average In-Sample Population Fitness

With this Exit Condition, the Evolution stops if the latest Generation's “Average Fitness Score” drops below the Moving Average line. You're already familiar with the concept of Moving Average for the “Average Fitness Score”. Similar as in stock prices, the Moving Average acts as a “support line” where the Average Fitness Score may rebound and resume its “uptrend”. Therefore if it breached such a strong support, there's a good chance that later generations will have lower and lower score.
Note the “Average Fitness Score” is taken from the in-sample period.

The only parameter here defines the “period” for the Moving Average. Similar as in stock prices' Moving Average, the longer the period, the stronger it acts as the support line. Therefore if a breach happens, it's a significant signal that a downtrend is imminent, instead of a false positive.
Moving Average Out-of-Sample Population Fitness

This is similar to the previous one, in that the Evolution is stopped if the “Average Fitness Score” drops below the Moving Average. But the “Average Fitness Score” is calculated from the out-of-sample period.
The idea is, we don't want subsequent generations to have lower and lower performance for the out-of-sample period. Remember, the Divine Engine was blind to the out-of-sample performance as it was creating the strategies (to avoid overfitting). Thus, as the Divine Engine creates higher performing strategies based on the in-sample period, this Exit Condition makes sure the out-of-sample performance are not decreasing, at the very least.
But that's just half the story, as the Divine Engine may also create lower and lower performance for the in-sample period. So the best way is to use this Exit Condition in tandem with the previous Exit Condition (Moving Average In-Sample Population Fitness). Thus we make sure that both in-sample and out-of-sample performance are not downtrending.

The one and only parameter here defines the “period” for the Moving Average. As you already know, a higher value is preferable for a truer signal.
No New High for Out-of-Sample Moving Average

This Exit Condition looks at the out-of-sample Average Fitness Score (the green line on the Fitness Series chart), that is: During the specified “period” (including the latest generation), if there's no new all-time high for the OOS Avg. Fitness Score, then the evolution is aborted.

It could be that the green line (during the period) is all lower than the previous ATH (which is outside the period), or, it simply reached the same score as the previous ATH; in both cases the evolution will be aborted. The idea is that each new high, provided it's not too far separated from the previous one, usually signifies further improvements for the out-of-sample Avg. Fitness Score.
So at least the out-of-sample performance for the strategies created are getting better; if not, abort before it consumes too much of your compute hour credit.
There's only one parameter for this, which defines the “period” (the number of generations) to look back, starting from the latest generation. As usual, you don't want to set a short period here, since this is an Exit Condition and you must give some leeway for the evolution to mature.

Now, despite the name “… Moving Average”, this Exit Condition does not actually employ Moving Average at all. Instead, it implies the “moving window of generations” for the Average Fitness Score OOS.
Notes:
- The very first time a strategy has its Divine Engine enabled, an Exit Condition is already added, that is, the “No New High for Out-of-Sample Moving Average” with the “period” set to 10. If you don't want to use this, delete it with the trash-bin icon.
- Exit Conditions are only available to the Evolutionary search mode. Random search mode doesn't have them.
- Always remember that Exit Conditions may reduce your chance of finding the best strategy, as the Evolution gets stopped before it matures. So craft the Exit Conditions to meet its intended purpose, that is to cut short a potentially fruitless search (in order to save those precious compute-hour credits). That means setting a wider tolerance for them. Remember, you don't use Exit Conditions to define the criteria you want in a strategy, you use them to stop the Evolution. If the generation amount is small (as defined in the properties Min. & Max. Generations), you may do away with the Exit Conditions altogether.
- The random nature of Divine Engine backtests means, each run may yield different strategies from the other, even with the same exact settings. So you can use Exit Conditions to stop a fruitless search, and start over with the same settings. Sometimes you can restart PB in order to refresh the “random seed”, and see if the Evolution improves.
- It's recommended to use just one Exit Condition, so as not to tighten the tolerance and prematurely end the Evolution. But if you decide to use multiple Exit Conditions, do understand that they work like Sell Filters: for the Evolution to be stopped, only one Exit Condition needs to get triggered, not all of them at once. Exit Conditions use the “OR” operator between them, not “AND”.
Random
1. Search Algorithm – We'll now delve into the Random search algorithm. Obviously, we'll set this property to “Random” instead of Evolutionary.

So now we have different properties shown on the Backtest Parameterization Panel, to conform with the Random mode:

The Random mode is much simpler than Evolutionary. In fact it's the original form of the Divine Engine before Evolution was developed. If you're familiar with this tutorial, then you know a lot about the Random mode. This page is only for those craving the nitty gritty technical details.
The Random mode is best suited for fine-tuning a strategy's values. So you have an existing strategy, and you believe in its rules and filters, but you want to find values (of the parameters) that give the best possible performance. Through brute force, the Divine Engine exhaustively tests all possible values and combinations (within your parameterization ranges) and give you the best ones.
Sometimes this is the most sensible thing to do. You don't want to waste time finding a completely new system. You have a system that you trust for years. Let's say, you were a manual trader who used momentum oscillators, like RSI and CMO, along with Retracement lines as support and resistance. So you keep those filters, but let the Divine Engine find the best values. Who knows, maybe the 14-days RSI you've been using is not the optimal period? Or that the RSI levels of 70 and 30 are not the best representation of overbought and oversold conditions?

Note that a “Random” backtest can only be executed locally in your computer. You do this by clicking the button “Start Local Test”, not the button “Start the Boss”. A confirmation dialog then shows up, allowing you to add a memo for this backtest, along with a warning that a local test may hog all your computer resources:

If you don't want this obtrusive dialog to appear each time you start a local backtest, tick the checkbox “Don't show again”. Once done, click the button “Continue” to actually start the backtest. A memo is optional, as it's simply a description of each backtest you did. Each backtest (and its memo) can be seen under the Divine Engine Results Tab:

2. Execute n Random Backtests… – This property allows you to set the amount of iterations to be backtested.

An iteration consists of one strategy: a variant of your strategy with its distinct values and combinations. For example, “Iteration 1” contains the RSI Filter with the settings “10 days” and “85 RSI level”. Then “Iteration 2” has the settings “28 days” and “65 RSI level”. And so on and so forth.
This property contains three fields (of which, only one is user editable):

- n Parameter Execution Count – This field can't be customized. It shows the “multiplier” for the amount of iterations. The multiplier is calculated by: (A). Finding how many parameters, or fields, are parameterized by you. (B). Finding the amount of parameterized values, or steps, on a field with the highest amount of parameterized values. (C). Multiply A by B.


The idea for this calculation is that: even if you backtest only the absolute minimum of iterations, not only all values will be tested (parameterized values across all parameters), but some of their combinations as well.
- Next is the only field that you can customize. A number that you set here will be multiplied by the previous “n Parameter Execution Count” to yield the final amount of iterations to be backtested. As stated earlier, you can set this to a value of 1 (which is the logical minimum), and all the different values that you parameterized are certain to be backtested, along with some of their combinations. The maximum value you can enter here is 100.

- Finally, a field that shows the final amount of iterations to be backtested. Let's say this field shows “300”, then there will be 300 iterations (300 different strategies) backtested by the Divine Engine. This field can't be edited by you, as it merely shows the result of multiplying the previous two fields.


Preferably, the amount shown here matches the “Number of Parameter Combinations”. You do this by adjusting the editable field previously explained.

Matching them means all parameterized values and all of their combinations will be backtested. Thus you tell the Divine Engine to do its most exhaustive search; not a single value and not a single combination will be left out. But often this means an impossibly huge iteration amount, thus an impossibly long backtest time. If that's the case, you can set the previous user-editable field to a value of 2, 3, or 5.

3. Number of Parameter Steps – This property is not editable. It shows you the amount of values (steps) that you parameterized, across all parameters.

For example on the “RSI Filter”, you parameterized its period parameter with a range of 5 to 25 days and a step of 5. That means there are 5 values parameterized (5, 10, 15, 20, and 25 days).

And then the RSI threshold is also parameterized with a range of 0 to 100 and a step of 10. That means 11 different values are parameterized (0, 10, 20, 30, 40, 50, 60, 70, 80, 90, and 100).

The ranking rule “PB Pattern Score” also has its third parameter parameterized to include all values there: “PB Velocity Score”, “PB Pattern Score”, and “PB Velocity*Pattern Score”. Thus we have 3 values parameterized here.

So across three parameters above, we have a total of 19 different values parameterized (5 + 11 + 3). As shown on the “Number of Parameter Steps”:

If you recall about the property “Execute n Random Backtests…” earlier, even if you set it to a value of 1, not only the 19 values are backtested, but some of their combinations as well. As attested by the final amount of iterations (33) that well exceeds the value of 19:

Note, when a rule is set to “Replaceable” (or “Random”), that means 2 values are parameterized.

4. Number of Parameter Combinations – This property is not editable. It shows the total amount of combinations from the parameterized values.

So, continuing from the previous example (no. 3 above), we have a total of 165 combinations. This is calculated by multiplying the amount of parameterized values across all parameters: 5 x 11 x 3 = 165.
One “combination” is a distinct mix of different values. For example, the RSI period of “5 days” is combined with the RSI Threshold of “50” along with the value “PB Velocity Score”. That's one combination. The next combination could be the RSI period of “10 days”, RSI Threshold of “70”, and the value “PB Pattern Score”, for example. And so on and so forth.


Essentially, 1 combination is 1 iteration (1 distinct strategy). That's why as stated earlier, it's best to set the property “Execute n Random Backtests…” to match this property “Number of Parameter Combinations”, so that each and every combination is tested.

5. Pulling the Top Strategies – Now that we've set the amount of iterations and start the Divine Engine backtest, Top Strategies will be pulled (recorded) to the Divine Engine Results Tab, even as the Random search is progressing.

Note, instead of “Gen.” (Generation) as in the Evolutionary search, Top Strategies are listed based on their “Iteration” number. The Iteration that beats a previously listed Iteration (in terms of its “Fitness IS” score) will then be listed on this Divine Engine Results Tab.
Unlike Evolutionary search where backtests are done in the order of earlier Generations toward the later Generations, Random search backtests lower-numbered Iterations and higher-numbered iterations at the same time. Remember that Random search assigns random values & combinations for each Iteration; there's no such thing that higher-numbered Iterations are building up from the lower-numbered Iterations.
This is how the Random search backtest is performed:
- In the beginning, the Baseline strategy is backtested. A Baseline strategy is the original strategy you created yourself, with your own values. It is then listed on the Divine Engine Results Tab, as one of the Top Strategies.
- Then, the first “batch” of iterations are backtested. The amount of iterations on this first batch corresponds to the amount of CPU cores (threads) on your computer. Let's say you have 24 cores, then 24 iterations will be backtested simultaneously (assuming you set the max amount of RAM for PB). And, as stated earlier, lower-numbered Iterations and higher-numbered Iterations alike will be included in this first batch. For example, if we have 1188 iterations (as set on the property “Execute N Random Backtests”), the first batch consists of Iterations 1, 50, 99, 148, 197, 246, 295, 344, 393, 442, 491, 540, 589, 638, 687, 736, 785, 834, 883, 932, 981, 1030, 1079, and 1128. Those are 24 iterations, and between each iteration there's an interval of 49 iterations. This interval is calculated by dividing the total amount of iterations by the amount of cores you have (1188/24 = 49, rounded down).
- An Iteration that beats the Baseline strategy is then listed on the Divine Engine Results Tab; let's say Iteration 50. Then another Iteration that beats Iteration 50 is also listed there; let's say Iteration 393. So, we have 3 top strategies listed there: Baseline, Iteration 50, and Iteration 393.

- The backtest then continues for the second batch, which is 1 iteration away from the first batch. So the second batch consists of: Iterations 2, 51, 100, 149, 198, 247, 296, 345, 394, 443, 492, 541, 590, 639, 688, 737, 786, 835, 884, 933, 982, 1031, 1080, and 1129. There are 24 iterations as usual, and the top strategies are pulled (recorded) the same way as in the first batch.
- This continues for the rest of the batches, until all 1188 iterations are backtested. Thus the third batch: Iterations 3, 52, 101, 150… The fourth batch: Iterations 4, 53, 102, 151… and so on and so forth.

So why pull multiple top strategies instead of just the one best strategy, if the idea of Random search is to find the best values & combinations? Remember that the Divine Engine is blind to the out-of-sample performance. Thus it could be that the best of the best strategy, despite performing well on the in-sample period, is actually a loser for the out-of-sample period. Besides, different strategies may have different metrics performance (CAGR, Drawdown, etc). So you're given multiple “flavors” to choose from, to suit your preferences.
Note:
- Exit Conditions don't exist for the Random search. There's no need to stop the backtest on the assumption that “later” iterations have lower and lower performance, no. That's because all iterations are completely independent of each other, they're not building up from earlier-backtested Iterations.
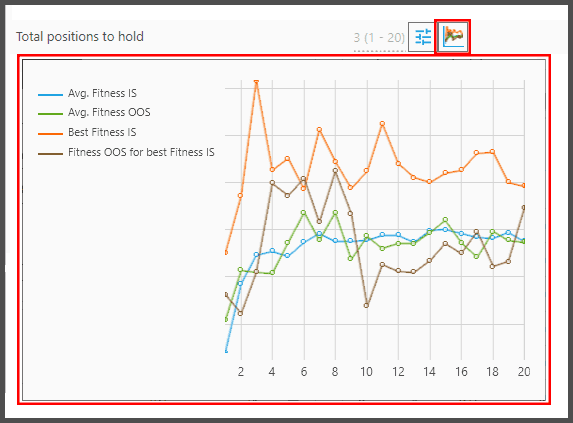
6. The Mini Chart – When the backtest is finished, each parameter (that you parameterized) has a Mini Chart. It shows the parameter's performance across the different values that you parameterized.
To open this chart, click on the colorful button beside each parameter. The Mini Chart then pops up. Note that Mini Charts are exclusive for Random search; the Evolutionary search doesn't have them, even if you parameterized the parameters.
Let's now discuss the Mini Chart's components:
- The horizontal axis represents values that you parameterized. Let's say the parameterization range is 5 to 30 days, with a step of 5 days: the horizontal axis thus represents the values 5, 10, 15, 20, 25, and 30 days. Ditto if you parameterized the values “Above” and “Below” (or “Highest” and “Lowest”), the horizontal axis represents those values you chose.


If you have so many values parameterized, the horizontal axis will be crowded that some values don't have their own labels. But they're still there, plotted correctly.
- The vertical axis represents the Fitness Score. Obviously, this Fitness Score comes from whatever Fitness Functions you set.

We don't show the axis' labels (the Fitness Score scale) as it would clutter the chart more. Instead, you can hover your mouse on the chart to show a tooltip. The tooltip shows the various Fitness Score of a given value.

So, you hover the mouse over a certain value, let's say “25”. That value of “25” has four Fitness Score: “Avg. Fitness IS”, “Avg. Fitness OOS”, “Best Fitness IS”, and “Fitness OOS for Best Fitness IS”. Let's discuss them now:
- “Avg. Fitness IS” – this is represented by the blue line. It shows the values' “Average Fitness Score” for the In-Sample (IS) period. Unlike the Evolutionary's “Average Fitness Score”, the Fitness Score here is the average of all iterations (strategies) that happened to use the value (that you hovered on).

Let's say, of all the strategies that used the value “25”, their Fitness Score (IS), averaged, is 4.1.
- “Avg. Fitness OOS” – represented by the green line. It's similar to the previous one, except now it's for the Out-of-Sample (OOS) period.

For example, strategies that use the value “25” (for this parameter) have the Fitness Score during the out-of-sample period averaged as 3.47.
- “Best Fitness IS” – represented by the orange line. It shows every value's highest Fitness Score during the in-sample period.

For example, of all strategies that used the value “25”, there's one strategy with the highest Fitness Score (IS) of 4.96. Thus 4.96 is the “Best Fitness IS” for the value 25.

If you look at a parameter's Mini Chart, a value with the highest “Best Fitness IS” (highest orange line) is the value that's deemed best for that parameter and thus applied for it. Such value is shown outside the parentheses (as seen on the screenshot above).
- “Fitness OOS for Best Fitness IS” – represented by the brown line. This is the Fitness Score during the out-of-sample period, for the strategy with the “Best Fitness IS” (as explained above).

For example, of all strategies that used the value “25”, one strategy has the highest Fitness Score in-sample. And that strategy's Fitness Score out-of-sample is shown in this brown line.
Now, sometimes you may encounter a parameter with multiple Mini Charts:

This happens if a parameter with built-in values (such as “Above” and “Below”) is parameterized. Thus another parameter (e.g. period parameter) may show multiple Mini Charts, to show its different performance when “Above” and “Below” are used.

Keep in mind, the multiple Mini Charts only account for another parameter within the same filter.
Notes:
- When a rule/filter is set to “Random”, a Mini Chart is also shown next to that “Random” parameter. This is because “Random” means the entire rule is parameterized on whether it should be enabled or disabled. The Mini Chart for this parameter displays a horizontal axis of 0 to 1 (0 means the rule is disabled, while 1 means it's enabled).
- Different Top Strategies may have different Mini Chart appearance for the same parameter. For example, Iteration 10 has a different Mini Chart appearance from Iteration 50, despite the same SMA Period parameter. This is because: for a Top Strategy that is backtested later (in the last batch for example), its Mini Chart contains more data due to values that have been backtested earlier. Therefore it shows a different Mini Chart appearance from the earlier-backtested Iteration.
- The original value that you entered (i.e. before you parameterized the field) outside of the parameterization's range, will also be recorded on the Mini Chart.
- Some Mini Charts are so large their display is truncated. This is usually the case with complex filters. To view the hidden part, you can drag (move) the PB window and then open the Mini Chart again.
Fitness Functions
The “Fitness Function” section allows you to define the criteria you want in the strategies created by the Divine Engine.

A Fitness Function is essentially a metric, such as CAGR, Max.Drawdown, Avg.Position Gain, Sharpe Ratio, etc, which you can find on the Metrics Tab. The metric(s) that you choose, then, becomes the basis for measuring the strategies' performance. The Divine Engine will try its best to fulfill the metric's performance that you want.
In achieving that goal, the Divine Engine employs Fitness Function in different areas:
- They're used in the tournaments, for defining the survival of the fittest.
- They serve as the basis for the Avg. Fitness Score, to see whether the Evolutionary progression is healthy (with Exit Conditions).
- They're used for picking top strategies that will be served to you.
- Finally, Fitness Function is also used for drawing the Fitness Series chart, or the Mini Chart.
1. The very first time a strategy has its Divine Engine enabled, a Fitness Function is already added, which is “Score”.

“Score” is good overall as a Fitness Function, but it isn't specific. You may delete it with the trash-bin icon.
To add the Fitness Function(s), click the button “Add Fitness Function”:

A dialog appears, allowing you to choose whichever metric(s) you desire:
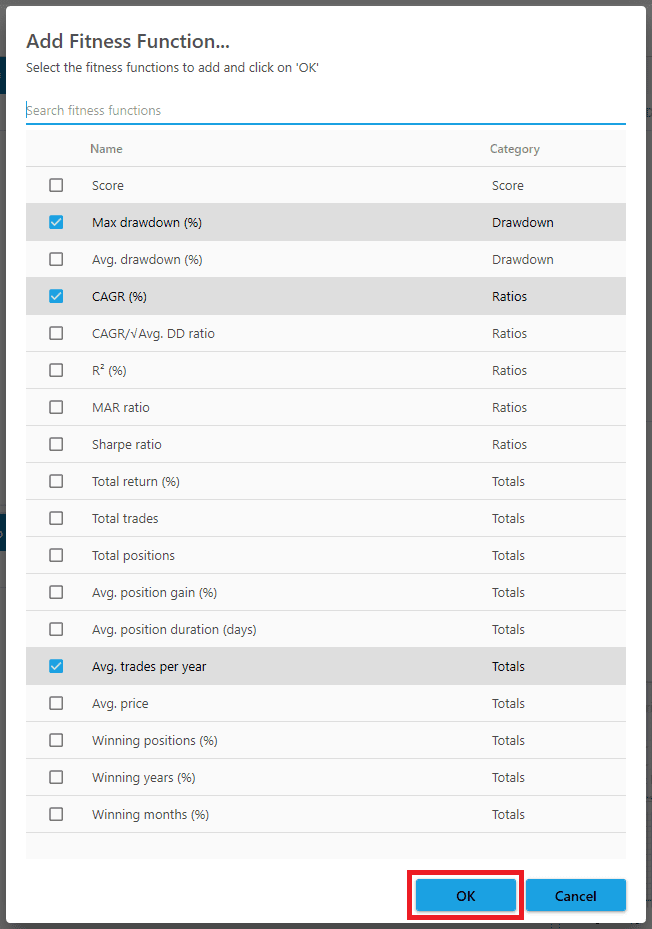
Once they're selected, press the OK button. They're then listed under the “Fitness Function” section:

Note that you must have at least one Fitness Function for the Divine Engine to work. This applies to both Random and Evolutionary search algorithms.
2. Now we'll define the criteria. We do this by modifying the Fitness Functions' parameters:

Each Fitness Function has three parameters, as shown above. We'll discuss each parameter next.
3. The first parameter defines how the metrics' value (score) will be pursued. You can pursue as high as possible a value, as low as possible, or target a certain value as close as possible. You can also set a cap (ceiling or floor) in chasing the metric's score.


As you can see above, we have five values for this parameter:
- Goal: The metric's score will be maintained as close to a target score as possible.
- At Most: The metric's score will be decreased as low as possible. It's only available in Drawdown metrics.
- At Least: The metric's score will be increased as high as possible.
- Minimum: The metric's score will be increased to a minimum value (floor).
- Maximum: The metric's score will be decreased to a maximum value (ceiling).
For example, if you choose “At Least” on the CAGR Fitness Function, the Divine Engine will try to create strategies with as high a CAGR as possible.
![]()
If you choose “At Most” for the Max Drawdown, it will create strategies with the lowest possible Max Drawdown, if necessary 0%.
![]()
If you choose “Goal” for the Avg. Trades Per Year, the Divine Engine will create strategies whose amount of trades average about X trades per year. X is the Avg. Trades Per Year you want, let's say 25 trades per year. So the strategies will have as close to 25 trades per year as possible, nothing more, nothing less.
![]()
Now, “Minimum” and “Maximum” are a bit more complicated. “Minimum” takes the metric score higher to reach the minimum value that you want, but not really pursuing any higher. It could be useful for some metrics like “Avg. Price”, “Avg. Trades per Year”, “Total Trades”, and “Total Trades/Rule Count”. With “Maximum” it's the opposite: the metric score is suppressed lower to reach the maximum value you want, but anything lower is just a bonus. It could be useful to the drawdown metrics.
In other words, they're a bit like “Goal” except they don't mind a better score. If the Maximum (or Minimum) target is easy to reach, for example a “maximum of 50% Avg. Drawdown”, then the Divine Engine will pick whatever strategies as long as their Avg. Drawdown is less than 50%, be they 30%, 10%, or 49%. It won't go out of the way to suppress the drawdown as low as possible.
Notes:
- We must warn you about the use of Drawdown metrics (either Max.Drawdown, or Avg.Drawdown). If your Fitness Function consists solely of this metric, and it's set to “At Most”, then your strategies are guaranteed to have 0% drawdown. But with 0% drawdown, they're also guaranteed to have 0% return. It's just the basic principle of investing. Now, if you have an existing strategy with good performance, the Divine Engine will break that performance so well, that you'll have 0% return along with the 0% drawdown. Therefore, it's never a good idea to use only the Drawdown metrics as your Fitness Function. Use other return-enhancing metrics as well, such as CAGR. Or at the very least, set those Drawdown metrics to “Goal” instead of “At Most”.
- Conversely, it's not a good idea to use just the return-enhancing metric, such as CAGR. With very high CAGR, you are likely to get very high drawdown as well. So to put the drawdown in check, use the Drawdown metrics too. If you decide to use just one Fitness Function, then it's highly recommended to use “Score”. The “Score” metric takes into account both CAGR and Max.Drawdown already. In summary, the final Fitness Functions you craft must consider both the return and the risk (expenses & fees too, if you will). To take in-depth tour of the various metrics, read the documentation for the Metrics Tab.
4. The second parameter defines the metric score that you want. This is the score that the Divine Engine will try at least to achieve.

For example, as shown above, the Divine Engine will try to create strategies with at most 30% Max Drawdown. Any strategies with Max Drawdown above 30% will be “punished”. They're less likely to survive in the tournaments. And any strategies with Max Drawdown less than 30% (the smaller the better), are likely to survive and generate offspring.
Ditto the CAGR: the Divine Engine will try to achieve at least that 40% CAGR, but the higher the better. As for the Avg. Trades Per Year, it's already explained before. That is, anything less than or more than 25 trades per year will be punished.
Keep in mind, the “punishment” or “reward” is merely semantics. What happens is that, any strategy that falls short of your metric threshold (let's say 35% CAGR instead of 40%), will have a Fitness Score less than 1. And any strategy that exceeds that threshold will have a Fitness Score greater than 1. It could be the case that your threshold is so high (let's say 200% CAGR), that most strategies fall short of that. In that case, even if they have the Fitness Score of 0.6, for example, they'll still trump those strategies with the Fitness Score of 0.4 (besting them in the tournaments). But generally, try not to find a unicorn with your Fitness Functions.
Later on, we'll discuss the Fitness Score, and the how & why the metric score is normalized into 1.
5. The third parameter defines the “Weight” for each Fitness Function, a.k.a. its “importance”. You can set each weight anywhere from 0 to 999,999. The actual weight applied is shown inside the parentheses (in relation to other Fitness Functions, which add up to 100%).

This is especially true if you're using multiple Fitness Functions, so you can set their importance relative to each other. Essentially, weighting allows you to reduce or magnify a Fitness Function's effect in relation to the others (if you only have one Fitness Function, you can set here any number and its actual weight will always be 100%).
This could be useful if you believe a certain Fitness Function could overwhelm other Fitness Functions, hence a lopsided strategy performance. For example, if you maximize Avg. Trades Per Year, its Fitness Score could be well over 1000 (even after it's normalized into 1), whereas CAGR merely has a Fitness Score of 1.5. Therefore the Divine Engine will pursue more trades per year instead of higher CAGR. So the solution is to decrease the weight on Avg. Trades Per Year into a very small value, like 1%, and increase the CAGR's weight to 150%, for example.
So logically, weighting is used to tell the Divine Engine which Fitness Function you'd like to be emphasized. If you like CAGR to be pursued more, then increase the CAGR's weight, and/or reduce the Drawdown's weight. Because if they both have the same weight, it could be that strategies have good Drawdown but underwhelming CAGR.
Good weighting comes after trial and error. So take a look at the Divine Engine's result, and see which metric has abnormally high score, especially if it's not the primary metric you want. Take a look at the Divine Engine Results Tab:

In the case of Drawdown metrics, see if they're not abnormally small. If any metric shows aberration, you can adjust its “Weight”, or at least set it to “Goal”. Then do another Divine Engine backtest.
6. Fitness Score: Now we'll discuss how the metric(s) score are normalized into a factor of 1, to yield the final Fitness Score.

As stated earlier, Fitness Functions serve as the basis for tournaments, exit conditions, and selection of top strategies. But to do those things, Fitness Functions' performance must be converted into a Fitness Score. So for example, it's not just a strategy's raw CAGR of 28.73%, the Max. Drawdown of 19.94%, and R² of 98.81% that will be used. It's these metrics score combined and normalized into 1, which will serve as the basis for tournaments, exit conditions, and top strategy selection.
And here's how the Fitness Score is calculated:
Take a look at the example below, a Top Strategy from Generation 41:

It has a Fitness Score (In-Sample) of 1.17, which comes from a CAGR of 47.59% and the R² of 97.16%. Here are the Fitness Functions used:

So how do those percentages translate into a Fitness Score of 1.19?
First we must calculate the Fitness Score for each metric (one by one) before we combine them to yield the final Fitness Score. Understand that, in-sample metric scores become in-sample Fitness Score, whereas out-of-sample metric scores become out-of-sample Fitness Score.
The in-sample Fitness Score will be the one used for most purposes, and that's what we'll calculate. Out-of-sample is only useful for some Exit Conditions (like Moving Average Out-of-Sample and In-Sample/Out-of-Sample M.A ROC exit conditions). Hence the Divine Engine is usually blind to the OOS performance.
We'll calculate the CAGR's Fitness Score first. Here's the formula:
- If the metric score exceeds the threshold: 1 + (Delta / Threshold) * Weight
- If the metric score misses the threshold: 1 – (Delta / Threshold) * Weight
- If the metric score is exactly the same as the threshold, the Fitness Score is exactly 1.
In our case, the 47.59% CAGR obviously “exceeds” the 35% threshold. Remember that we want a minimum of 35% CAGR, the higher the better. So if the CAGR is 23.52% for example, then it “misses” the threshold, thus we'd be using the second formula. In our case, we'll use the first formula:

As you can see above:
- “Delta” is the difference between the metric's score and the threshold value. So it's the difference between the strategy's 47.59% CAGR and the 35% threshold CAGR. Keep in mind that Delta is an absolute value, i.e. always positive, never negative.
- “Threshold” is obviously the threshold value as set on the Fitness Function. So it's 35% for the CAGR.
- “Weight” is the weight value set for the Fitness Function. In our case, it's 100% for the CAGR. But note, we don't use raw percentage value here, instead it's a factor of 1. For example, a weight of 100% becomes 1, 90% becomes 0.9, and 7% becomes 0.07. A value greater than 100%, such as 150% becomes 1.5, you get the idea.
So the Fitness Score for CAGR is:

Next, we'll calculate the Fitness Score for R². If you notice, R² uses the “Goal” option. When the “Goal” option is used, we're certain to use the second formula. That's because a metric score is almost guaranteed to miss the threshold value; either it misses above, or below the threshold value. Remember that “Goal” tries to target the threshold as close as possible, nothing higher, nothing lower. If in the rare case that the metric score matches exactly the threshold value, then we just give it a Fitness Score of 1, no questions asked.
In our case, the metric score for R² is 97.16%, with a threshold of 95%. It has a weight of 75%.
So, the Fitness Score for R² is:

Thus we have the Fitness Score for each metric:
- CAGR = 1.36
- R² = 0.98
Now we'll find the final Fitness Score from those two combined. The formula is pretty simple:

Since we have only 2 Fitness Functions, the calculation is thus:

So that's how we get the final Fitness Score of 1.17. This Gen. 41 strategy has gone through tournaments and turns up a winner.
Notes:
- The main reason for this normalization into 1 is that we can have multiple Fitness Functions combined fairly. Imagine, all the various metrics have different forms of score. CAGR may go from 0% to well beyond 200%, for example. Drawdown, on the other hand, merely goes from 100% to a bottom of 0%. Total Return may reach millions if not billions percent (across the decades). If we don't normalize such different scalings, it would be difficult to combine them into a unified performance report.
- As for the Drawdown metrics (when you use the “At Most” option), its formula for normalization into 1 is calculated differently (exponential). This is to address the fact that Drawdowns have a bottom of 0%, whereas most other metrics can go to heaven and beyond. Such a limited scale on Drawdowns could make unfair comparison to the other metrics, hence the exponential calculation.
- The options “Minimum” and “Maximum” are calculated rather similarly, except: anything that fails to meet the minimum (or maximum) score is given a Fitness Score less than 1. That is, you use the subtraction formula from 1. Anything better than such minimum (or maximum) value does not go higher than 1 (they're not rewarded), but given an exact value of 1, no matter how good the score is.
- A Fitness Score can not be negative, the smallest value is capped at 0. This is to avoid breaking the Fitness logic.
- The Fitness Functions you used define the metric columns shown on the Overall Top Results and Divine Engine Results Tabs:


Those columns can't be removed unless you delete the Fitness Functions.
Other Properties
Last but not least, we'll discuss the rest of the properties in this Backtest Parameterization Panel:

We'll discuss them based on their order of importance.
1. Rule Set Parameterization – This defines whether the Divine Engine is allowed to slap random new rules (filters) to your strategy. There are three values for this property:

- Manual: The Divine Engine won't add new rules. So all strategies contain the exact same rules as your Baseline (original) strategy. This is perfect for fine-tuning your strategy with Random search algorithm (finding the best parameter values for those existing rules).
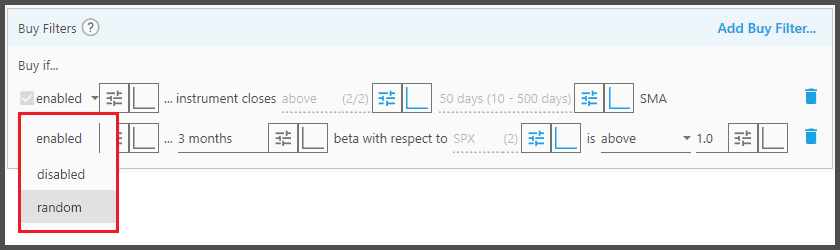
If you choose this value (Manual), each filter may be assigned these flags (at the leftmost parameter, as shown above):
-
- Enabled: The filter is kept, and exist in all the strategies the Divine Engine created.
- Disabled: The filter is discarded, and won't exist in the strategies it created.
- Random: The filter is randomly enabled and disabled, to see whether it's actually useful. Thus in some strategies this filter exists, while in others it doesn't.
- Random Selection: The Divine Engine is allowed to add rules & filters. This is perfect to create strategies from scratch with the Evolutionary search algorithm. In other words, your Baseline strategy doesn't have to contain any filters.

If you choose this value (Random Selection), any existing filter you have may be assigned these flags (at the leftmost parameter, as shown above):
-
- Not Replaceable: The filter is kept, and exists in all the strategies the Divine Engine created.
- Replaceable: The filter is more likely gone in the strategies it created, replaced by another filter.
Note, the random addition of filters may be affected by the number of parameters (and the value ranges) of each filter. More complex filters may have a higher chance of being added to the strategies. This is because with the wide and deep array of values, it's more difficult for such filters to find good value combinations. On the other hand, less complex filters may have an easier time getting good value combinations.
- Generate Cyber Code: This option is only available for those with the Cyber Code-capable licenses. It's similar to “Random Selection”, in that the Divine Engine is allowed to add new rules & filters. But instead of the built-in ones such as, RSI, SMA, Kaufman, or Aroon, it creates brand new technical indicators from scratch, whose internal codes are then evolved throughout the generations to create the ultimate indicators.

With this option, the rules & filters added by the Divine Engine are exclusively of this “Cyber Code” type (none of the built-in indicators), as opposed to the option “Random Selection”, which adds rules & filters of the built-in type only. So, they are mutually exclusive; either you want the Cyber Code indicators, or the built-in indicators, not both.
You can define how the new indicators are created through the Cyber Code Configuration window, accessed with the button highlighted in the screenshot above. Cyber Code Genetic Programming is a huge new feature by itself, so we'll dive deep into it in its own dedicated help page.
Note:
The option “Random Selection” can also be used for the Random Search Algorithm. That is, aside from fine-tuning existing parameters, the Divine Engine will also add random rules/filters (with their random values) to the strategies. There is no natural selection and evolution at play here, simply slapping random rules/filters for every iteration, in the hope it may beef up the strategies. Obviously rules/filters will be added for as long as there are iterations, as you see on the property “Execute n Random Backtests…”.

Therefore it's highly dependent on your parameterization of the existing parameters.
2. Use Current Rule Set as Baseline – This checkbox is used in tandem with the option “Random Selection”, explained above.

With this checkbox enabled (along with the option “Random Selection”), the Divine Engine is allowed to add new rules, and weigh whether the existing ones are useful. It's perfect for augmenting your Baseline strategy with new rules, utilizing the Evolutionary search algorithm. Ticking it ensures the Divine Engine will always give you results that are at least as good as the baseline strategy. But you must have a valid baseline strategy (complete, with its required rules; e.g. a Ranking Rule is a must). If you don't have a complete baseline and let the Divine Engine find the rest of the rules for you to complete the strategy, turn this checkbox off.
The existing filters may have the flag “Replaceable” and “Not Replaceable” similar to the previous one. But the difference lies in the “Replaceable” flag: instead of discarding the filter, the Divine Engine will weigh whether it's useful or not. The filter is more likely to be kept, but with parameter values assigned by the Divine Engine itself.

When a filter is set to “Replaceable”, you can't parameterize its parameters yourself. It's like saying to the Divine Engine, “You decide whether this filter is useful; and if it is, you decide the best values for it”. It's more efficient than flagging it as “Not Replaceable” and do the parameterization yourself; unless of course you want that filter to stay no matter what.
Such techniques can be used to guide (or kick-start) the Divine Engine to follow a certain path. For example, to avoid hindsight overfitting, the Divine Engine is supplied with a certain filter that prevents it from buying undervalued stocks, when such stocks were not yet part of an Index Portfolio (e.g. S&P 500). Such a filter could be the “Average Currency Volume Filter” set to buy above a certain dollar volume.
3. Randomize Ranking Rule Offsets – This checkbox defines whether the Ranking Rules “Offset” parameters will be randomized.

The default for these “Offset” parameters is “0 days”. If the checkbox is enabled (ticked), the Divine Engine will apply random days to those parameters. If the checkbox is disabled, they'll be applied 0 days as usual. To understand about the “Offset” parameter, read about it here.

Keep in mind, the randomization happens only to the Ranking Rules added by the Divine Engine (or if a rule is set to “Replaceable”). For those Ranking Rules you added yourself, their “Offset” parameters are unaffected by this checkbox. If you wish to randomize their “Offset”, you must parameterize them yourself.

4. Tournament Fitness Function Rotation – This property defines whether Rotational Fitness is used in the tournaments.

Rotational Fitness is a mechanism by which every tournament is given a Fitness Function different from the other tournament. As you may recall earlier, each tournament uses Fitness Functions to rank the 4 strategies' performance, thus defining the 2 survivors.
For example we have three Fitness Functions, CAGR, R2, and MAR:
- Without Rotational Fitness, each tournament uses the three metrics combined. Thus each of the 4 strategies has a Fitness Score from the combination of CAGR, R2, and MAR. This Fitness Score, in turn, defines the upper 2 strategies (survivors), and the bottom 2 (losers).
- But with Rotational Fitness, one tournament will be assigned CAGR to measure its 4 strategies' performance. Another tournament will be assigned R2. Yet another tournament will be assigned MAR, and so on and so forth.


The idea for Rotational Fitness is twofold:
- Each tournament produces survivors with distinct strength from the other tournaments. So one tournament has its survivors specializing in CAGR, while another tournament in R2. Their genes (rules & filters) are specifically designed for their strength. Otherwise, they all become jack of all trades and master of none. It's like different groups of organism: each with different environments and needs, thus each has distinct strength from the other groups. Eventually their offspring will breed, and the result is a more robust next generation.
- But more importantly, the reason for Rotational Fitness is to introduce noise to the tournaments. It's a revolutionary mechanism to produce robust strategies, with good in-sample and out-of-sample performance. So instead of hindsight overfitting to achieve that goal (which is detrimental), we use random noise.
Obviously, Rotational Fitness is only useful if you have multiple Fitness Functions. If you have but one Fitness Function, you can disable Rotational Fitness:

Now, let's examine the technical difference between the two flavors there:

Enabled – with this, the Divine Engine makes a list of all the Fitness Functions used; in our case, the list would be:
- CAGR
- R2
- MAR
Then: the first tournament gets the first item on that list (CAGR), the second tournament gets the second item (R2), and the third tournament gets the third item (MAR). Now that the list is fully “consumed”, it'll start from the beginning again. So the fourth tournament gets CAGR, the fifth tournament R2, the sixth tournament MAR, and so on and so forth until all tournaments are done.
Note, a Fitness Function's “Weight” also determines the amount it's listed there, in relation to the amount of other Fitness Functions. For example, if all Fitness Functions are weighted equally, each will be listed once; just like what we see in the list above. But if CAGR has a weight of 100%, while R2 is 75%, and MAR is 50%, then the list becomes:
- CAGR
- MAR
- R2
- CAGR
- MAR
- R2
- CAGR
- CAGR
- R2
Notice CAGR is listed 4 times, R2 3 times, and MAR 2 times, to account for their different Weights relative to each other. In other words, the “Weight” parameter defines how often that Fitness Function will be assigned to all tournaments–aside from the fact that “Weight” is also used as a multiplier to the Fitness Score itself. That means, as usual, that lower “Weight” indicates less importance in defining the character of the strategies.
Enabled: use permutations – This is similar to the previous one, except the list now includes the permutations (combinations) of the Fitness Functions, aside from the individual Fitness Functions themselves. Hence the list looks like:
- CAGR
- MAR
- R2
- CAGR + MAR
- CAGR + R2
- MAR + R2
- CAGR + MAR + R2
As usual, the “Weight” parameter also affects how the list is constructed.
Now you may wonder “What's the tangible difference for me, if I choose this or that flavor?”. Here's the answer:
- With Rotational Fitness “Disabled”, the Divine Engine may yield the highest performing strategies (at least for the Fitness IS score), but without any guarantee on its OOS (Out-of-Sample) performance. In fact, the strategies are more likely to have disparate performance between IS and OOS.
- With “Rotate Fitness Function”, the top strategies have similar (or a little lower) Fitness IS performance than “Disabled”. But the metrics' IS and OOS performance are improved noticeably, neither very high in favor of either IS or OOS, nor too low.
- With “Rotate Fitness Function Permutations”, the top strategies' Fitness IS are usually even lower than the previous two, but they have the best consistency (IS vs OOS), that is, the best when compared to “Disabled” or “Rotate Fitness Functions”.
5. Tournament Type – This property further modifies the way tournaments are executed.

Just like Rotational Fitness that modifies the tournaments' mechanism, this property also affects how winners are selected. When it's set to “Default”, tournaments are conducted as previously explained so far. But if you choose “Winner Takes All”, similar Fitness Functions are compared against each other (between the 4 strategies). For example, Strategy A's CAGR is compared against Strategy B's CAGR, and R2 against R2, etc.
The losing Fitness Function is then discarded altogether. It won't have any effects on that strategy's final Fitness Score. Finally, the 4 strategies are compared again as usual (based on this modified Fitness Score) to define the eventual survivors.
So each strategy doesn't have a fixed Fitness Score, which are then sorted as usual. Instead, their final Fitness Score depends on their opponent (the literal duel). By comparing the Fitness Functions individually, you basically prevent a 2nd best score to add to the final Fitness Score. That in turn, may give your strategies a slight advantage.
Notes:
- Rotational Fitness (and Winner Takes All mechanism) merely affect how the tournaments are conducted, i.e how the survivors are determined. The general Evolutionary mechanisms are not affected, i.e Cross-Breeding, Mutation, Average Fitness Score, the picking of top strategies, etc.
- When using Rotational Fitness, the orange line on the Fitness Series chart may go down. If Rotational Fitness is disabled, that line can either stay flat or go up, never down. The reason for this: the orange line represents the best strategy of each generation (its Fitness IS score). Normally, the best strategy survives and becomes the next generation's best strategy as well, unless there's an offspring strategy besting it. But with Rotational Fitness, the best strategy could be killed, when in the next gen's tournament that strategy is assigned a Fitness Function different from the previous one, thus losing it; so if the next generation doesn't contain any strategy that's similar or higher in score than that top strategy, the orange line will drop.

Notes:
- Theoretically, Genetic Algorithm (as represented by the Evolutionary Search Mode) will find the strategy you want. Even more so if you utilize Genetic Programming (Cyber Code Engine). You just need to have a very, very long evolution, along with myriad variables (market data) thrown in, which means enormous amount of computing power spent. Imagine how the human species have evolved from single-celled organisms to space-faring advanced civilizations through billions of years of evolution. But obviously, something that guides the evolution must also be present, to achieve that goal ultimately. That means you must design the Fitness Functions to be faultless: logical, non-contradictory, and above all non-utopian. That is, for example, a 100% straight equity-curve can only exist if nobody is buying and selling through greed or panic.
- If you have The Boss unlimited license, you have 25,000 compute hour credits given to you freely each month. When you're about to run out of credits, an email notification will be sent to you. Do understand, despite the vast amount of computer core we have, we can't process unlimited number of backtest per month, hence the necessity to cap each user at 25,000 compute hour credits each month. It's also to avoid excessive use of The Boss by some enthusiastic members.
- It's not a good idea to whip the Divine Engine hundreds of times to find that holy grail. That's called overfitting, and the chance the resulting strategies would work in real life is reduced by 1% for each Divine Engine run. If the same strategy rules, parameters, settings, and Portfolios are subjected to 10 Divine Engine runs, let's say, then there's a 10% chance the resulting strategies won't work in real life, despite showing good in-sample and out-of-sample performances. You can alleviate this overfitting problem somehow, with the use of Super Out-of-sample.
- You can check the Portfolio Boss Status Page at https://status.portfolioboss.com for the current state of The Boss service and TAP data downloads (if you use TAP data on the Cyber Code Engine). See if they're running smoothly:

Discount Applied Successfully!
Your savings have been added to the cart.
Report
Block Member?
Please confirm you want to block this member.
You will no longer be able to:
- See blocked member's posts
- Mention this member in posts
- Invite this member to groups
- Message this member
- Add this member as a connection
Please note: This action will also remove this member from your connections and send a report to the site admin. Please allow a few minutes for this process to complete.
Report