What happens after gap n crap days?
Corona Del Mar, CA |
Thursday's gap n crap was an epic reversal. |
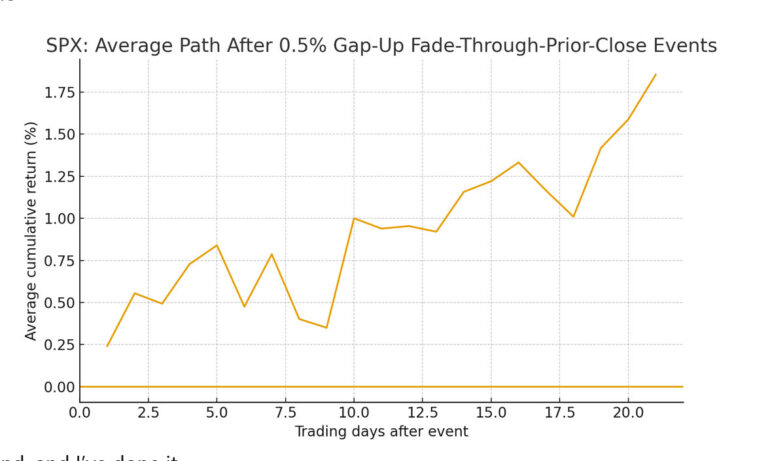
Clearly there's a bullish bias over the next month.
I wouldn't trade this though. Not enough samples for statistical significance. It's not a trading strategy.
But I do find it interesting considering folks said it was a bad omen. As usual, they're wrong because they don't put in a few minutes of work. They create a story in their head about what the market will do next.
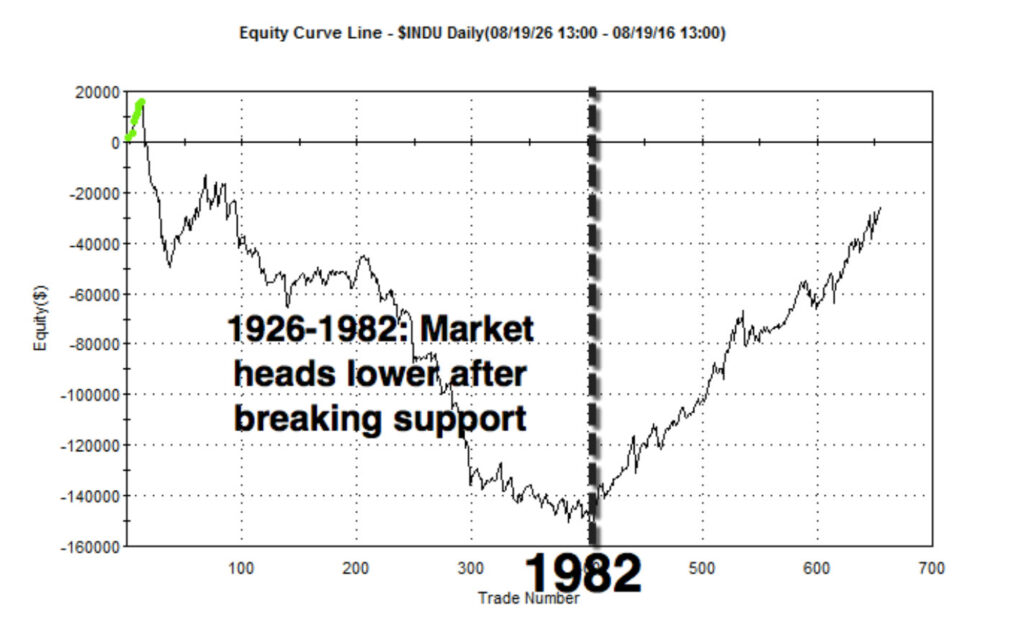
This comes as no surprise to me because many years ago, I did the research, and noted how price action completely changed in 1982.
That's when S&P 500 futures were introduced. The crazy leverage creates more mean reversion than trend.
Here's what happens when you buy a 20-day low and sell a 5-day high. From 1926-1982, it resulted terrible returns. Now the market tends to reverse after a “support” break.”
The old farts I still follow from the 90's never changed their tune. They're still drawing lines on charts. Still yapping about stuff they learned from Edwards and Macgee 50 years ago. |
Make sure to follow me on X for more raw and unfiltered updates:
https://x.com/PortfolioBoss

Trade smart,
Dan “Prince of Proof” Murphy
Government required disclaimer: The results listed herein are based on hypothetical trades. Plainly speaking, these trades were not actually executed. Hypothetical or simulated performance results have certain inherent limitations. Unlike an actual performance record, simulated results do not represent actual trading. Also, since the trades have not actually been executed, the results may have under (or over) compensated for the impact, if any, of certain market factors such as lack of liquidity. You may have done better or worse than the results portrayed.


Responses