It’s 2020 Why Are We Still Drawing Lines On Charts
Corona Del Mar, CA
Howdy Friend!
1997.
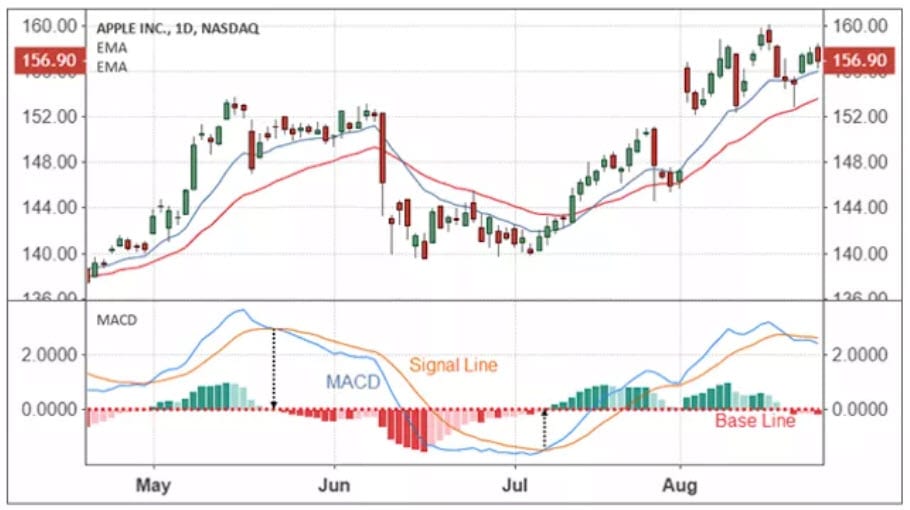
That was the year I had a short-lived affair with the lovely MACD indicator. She has since become a side-piece in an ever-expanding harem of indicators.
She was so seductive at the time…

…I craved exact buy and sell signals — and she delivered.
When the histogram went above the zero line I'd buy.
When it went below, I'd sell.

I might as well have started flapping my arms in hopes of flying because that kind of naive trading system works just about as well.
Ironically, those rules actually do much better in reverse since stocks tend to revert to the mean more than trend.
When I actually did the hard work of back testing the “system,” I dropped MACD like a radioactive hot potato.
The goal is to make F U money, not take a one way trip to the poor house right?
Fast forward a few months and I read Edwards and Magee where they shared charts with trend lines drawn on them — as if there was some sort of mysterious predictive power doing so.
They published their original book in 1948!
I only bring this up because I opened up the March edition of a popular trading magazine…and they were STILL drawing lines on charts!
It's 2020!
Edwards and Magee of course weren't the first to hypothesize that price behavior could bring trading profits (which is true, but implemented in a very crude manner).
Ralph Elliot (1871-1948) believed that price behavior moved in a series of complex waves.
He did not have access to a computer where he could back test his ideas with precision.
I did…and even the hypothesis that Fibonacci ratios are useful is wrong.
There are numbers that repeat, but they certainly aren't Fibonacci's.
I even spend over a year (with my team) searching for repeatable price patterns.
Thousands of man hours. Tens of thousands of compute hours.
Using automation, I tried every possible combination with the help of the fastest computers in the cloud — it was a dead end.
Traders don't want to admit that price data is mostly noise and randomness.
The lines on charts are a primitive security blanket from another era — akin to throwing a poor virgin into the erupting volcano to appease the gods.
Yikes — talk about confusing cause and effect! Chastity was a serious liability around volcanoes.
When we launched Portfolio Boss in 2014, many were shocked when they saw the rules behind the “Exponential Growth/DB Transaction” strategy.
The profits came from ranking the stocks against each other.
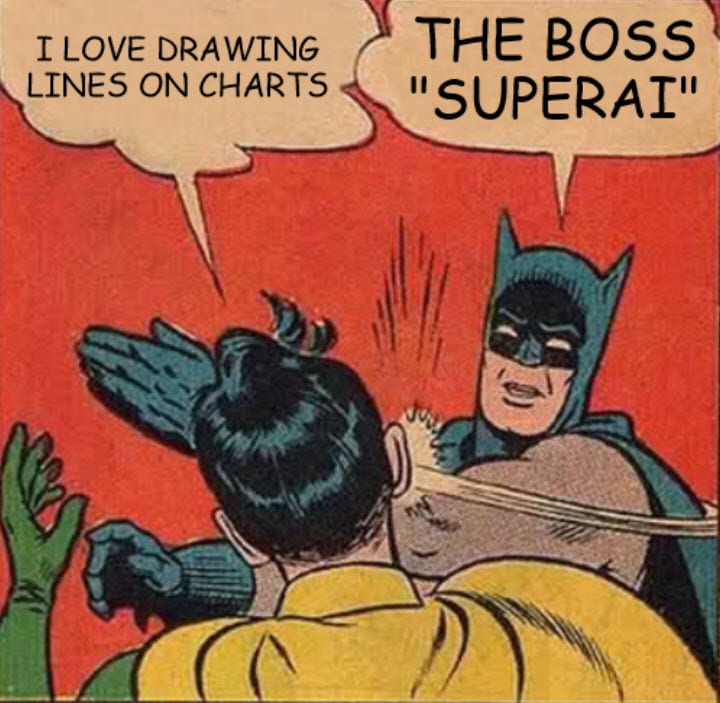
Right now we're putting the finishing touches on The Boss “SuperAi” strategy builder…
…when you see the results, I think you'll be shocked once again at the secrets it has uncovered.
I've been meaning to reveal them to you during a live webinar, but I've been waiting for a few surprising features to be added.
It's 2020. We should be using the latest tools to pull money outta the stock market right?
More from me soon!…
|
|
Government required disclaimer: The results listed herein are based on hypothetical trades. Plainly speaking, these trades were not actually executed. Hypothetical or simulated performance results have certain inherent limitations. Unlike an actual performance record, simulated results do not represent actual trading. Also, since the trades have not actually been executed, the results may have under (or over) compensated for the impact, if any, of certain market factors such as lack of liquidity. You may have done better or worse than the results portrayed.


Responses