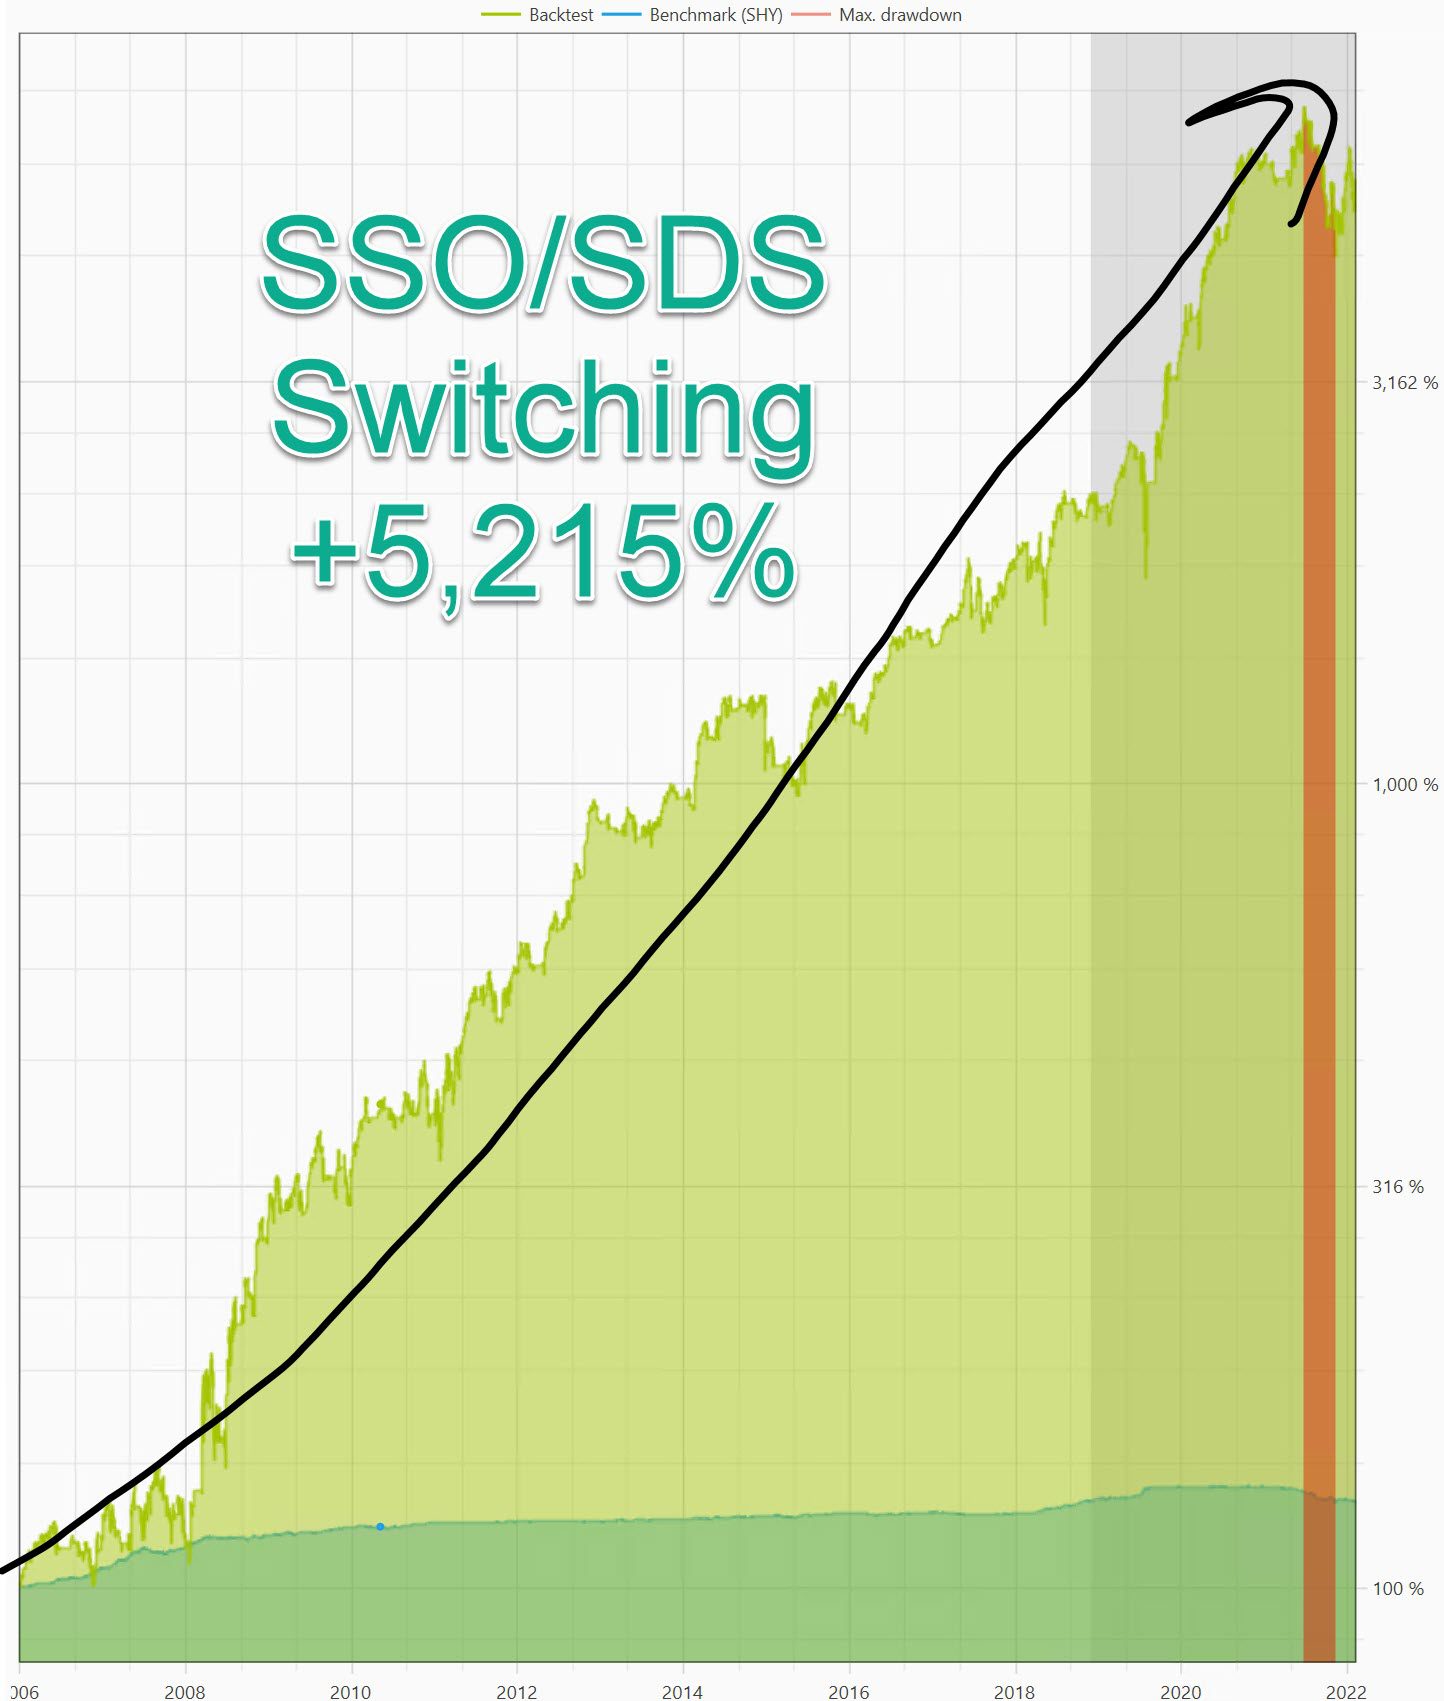
#1 Indicator for Trading the S&P is…
|

Shaded area is out-of-sample to confirm strategy isn't over-fit to the past |
Now I HATE bad fills (slippage)...you know...where you go to buy a stock for 50.00 and you end up getting in at 50.15. It adds up.
So I told The Boss to build me a strategy using limit orders.
That way it buys at a price below the closing price of SSO for a terrific entry.
Then you sell it a certain amount above the closing price so you get a great exit price...a one-two punch.
I talk about this sort of thing in this free report.
So what was the #1 indicator for this trading strategy? Was it MACD? Chaikin? RSI? Stochastics? Bollinger bands?
Naw...those rarely get picked. That's what the majority of TA chartists look at.
What the majority knows isn't worth knowing when it comes to trading.
This strategy had only one indicator: A trailing ATR stop loss.
"ATR" is a volatility indicator.
So if there's a significant down day compared to the past couple months, it gets out.
What makes the strategy so profitable is the use of those limit orders. It's always looking for a deal.
Bonus
The Boss created an even better strategy with 12,633% return over the same period (2007-2022).
What was the #1 indicator?
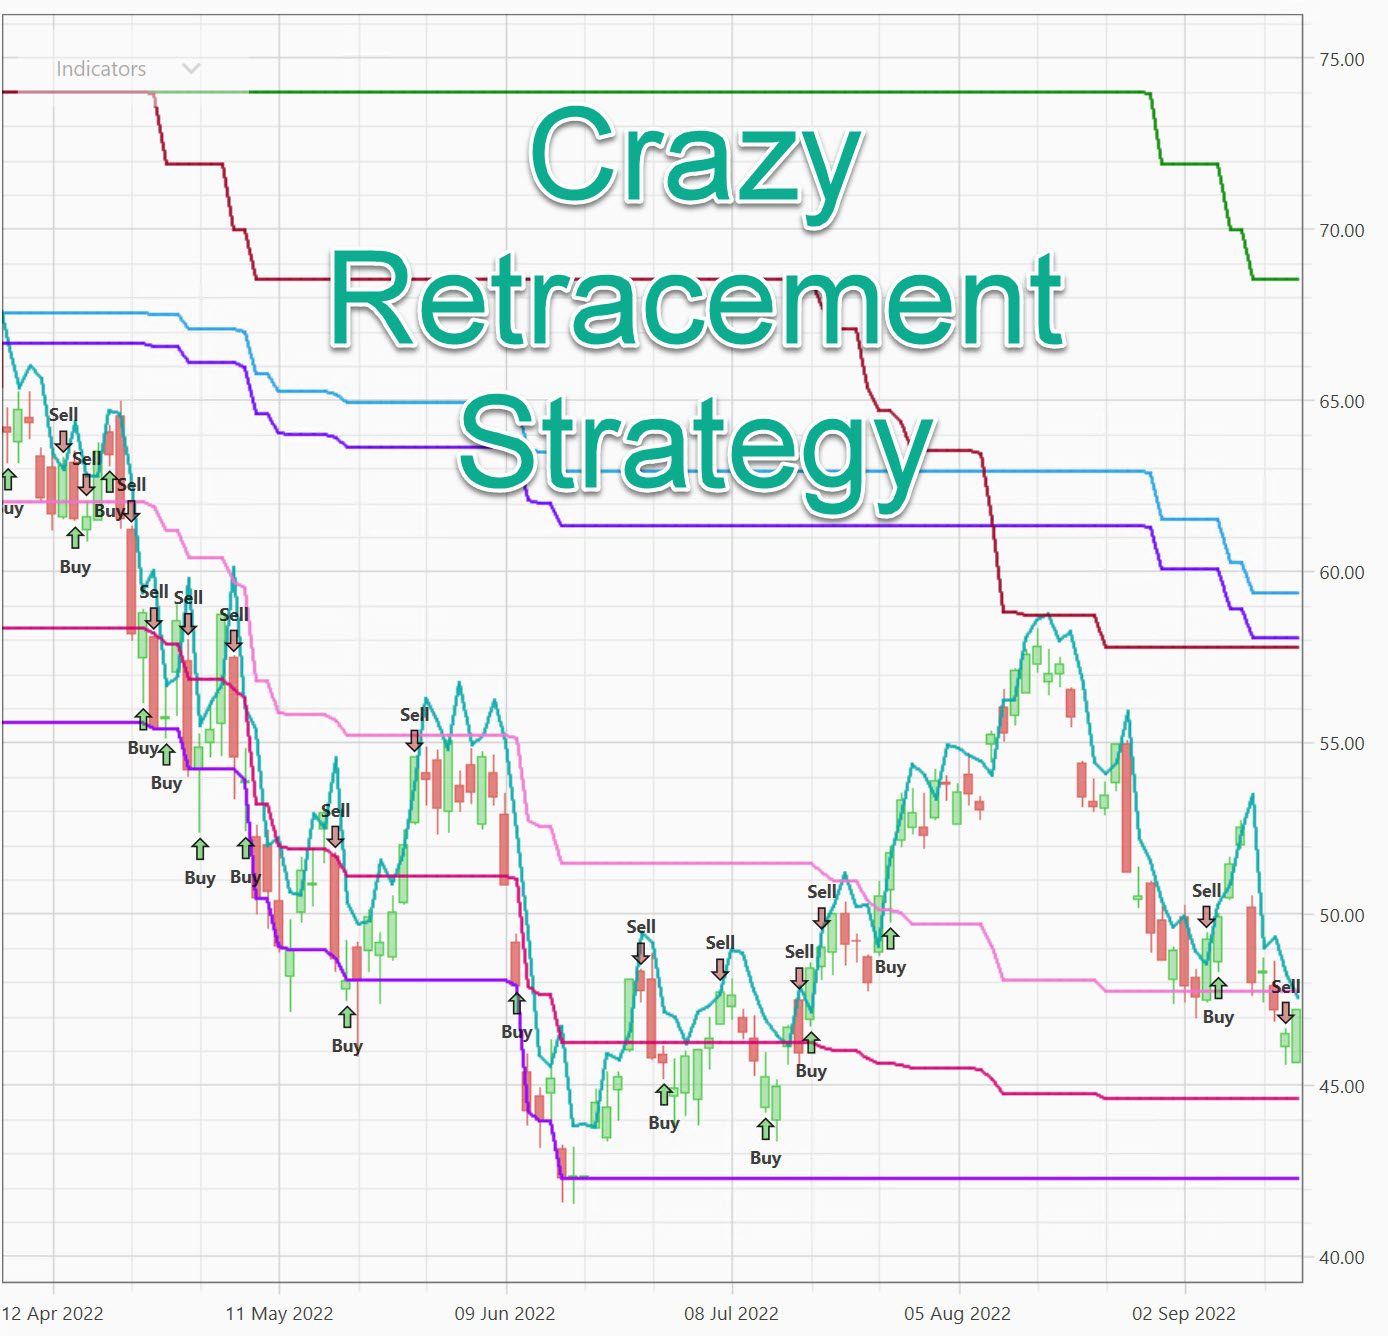
"No go retracement zones."

This one is so strange and has nothing to do with Fibonacci levels.
And it's only two trading rules.
But I'm running out of time today.
I'll talk more about it in the next update...and it has everything to do with current events in the markets.
Until then, grab this report on why you want to use limit orders with your trades.
Everyone talks about the 1,200X return of Apple since 1980.
It's actually faster and more consistent to make a bunch of quick little gains, and you won't have a heart-attack when your favorite stock sinks -84% over a ten year period like Apple did (1987-1997).

|
|
Disclaimer: The results listed herein are based on hypothetical trades. Plainly speaking, these trades were not actually executed. Hypothetical or simulated performance results have certain inherent limitations. Unlike an actual performance record, simulated results do not represent actual trading. Also, since the trades have not actually been executed, the results may have under (or over) compensated for the impact, if any, of certain market factors such as lack of liquidity. You may have done better or worse than the results portrayed.


Responses