Implosion!
Corona Del Mar, CA
Howdy Friend,
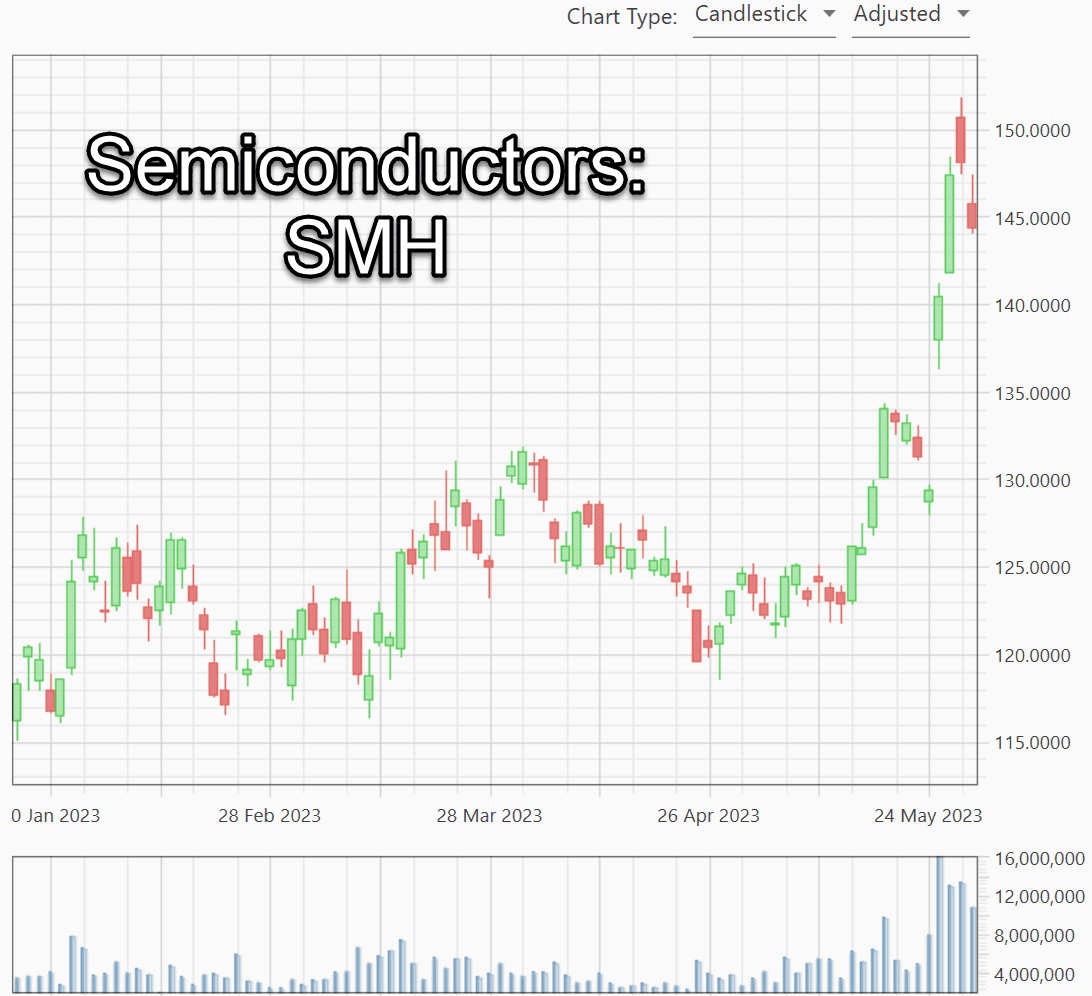
There's something absurd going on in semiconductors…and no, it's not really the price, even though they've gone up a bunch: |

It's not even about the premium of SMH hitting a 2.5-year high, which isn't really that big of a deal: |

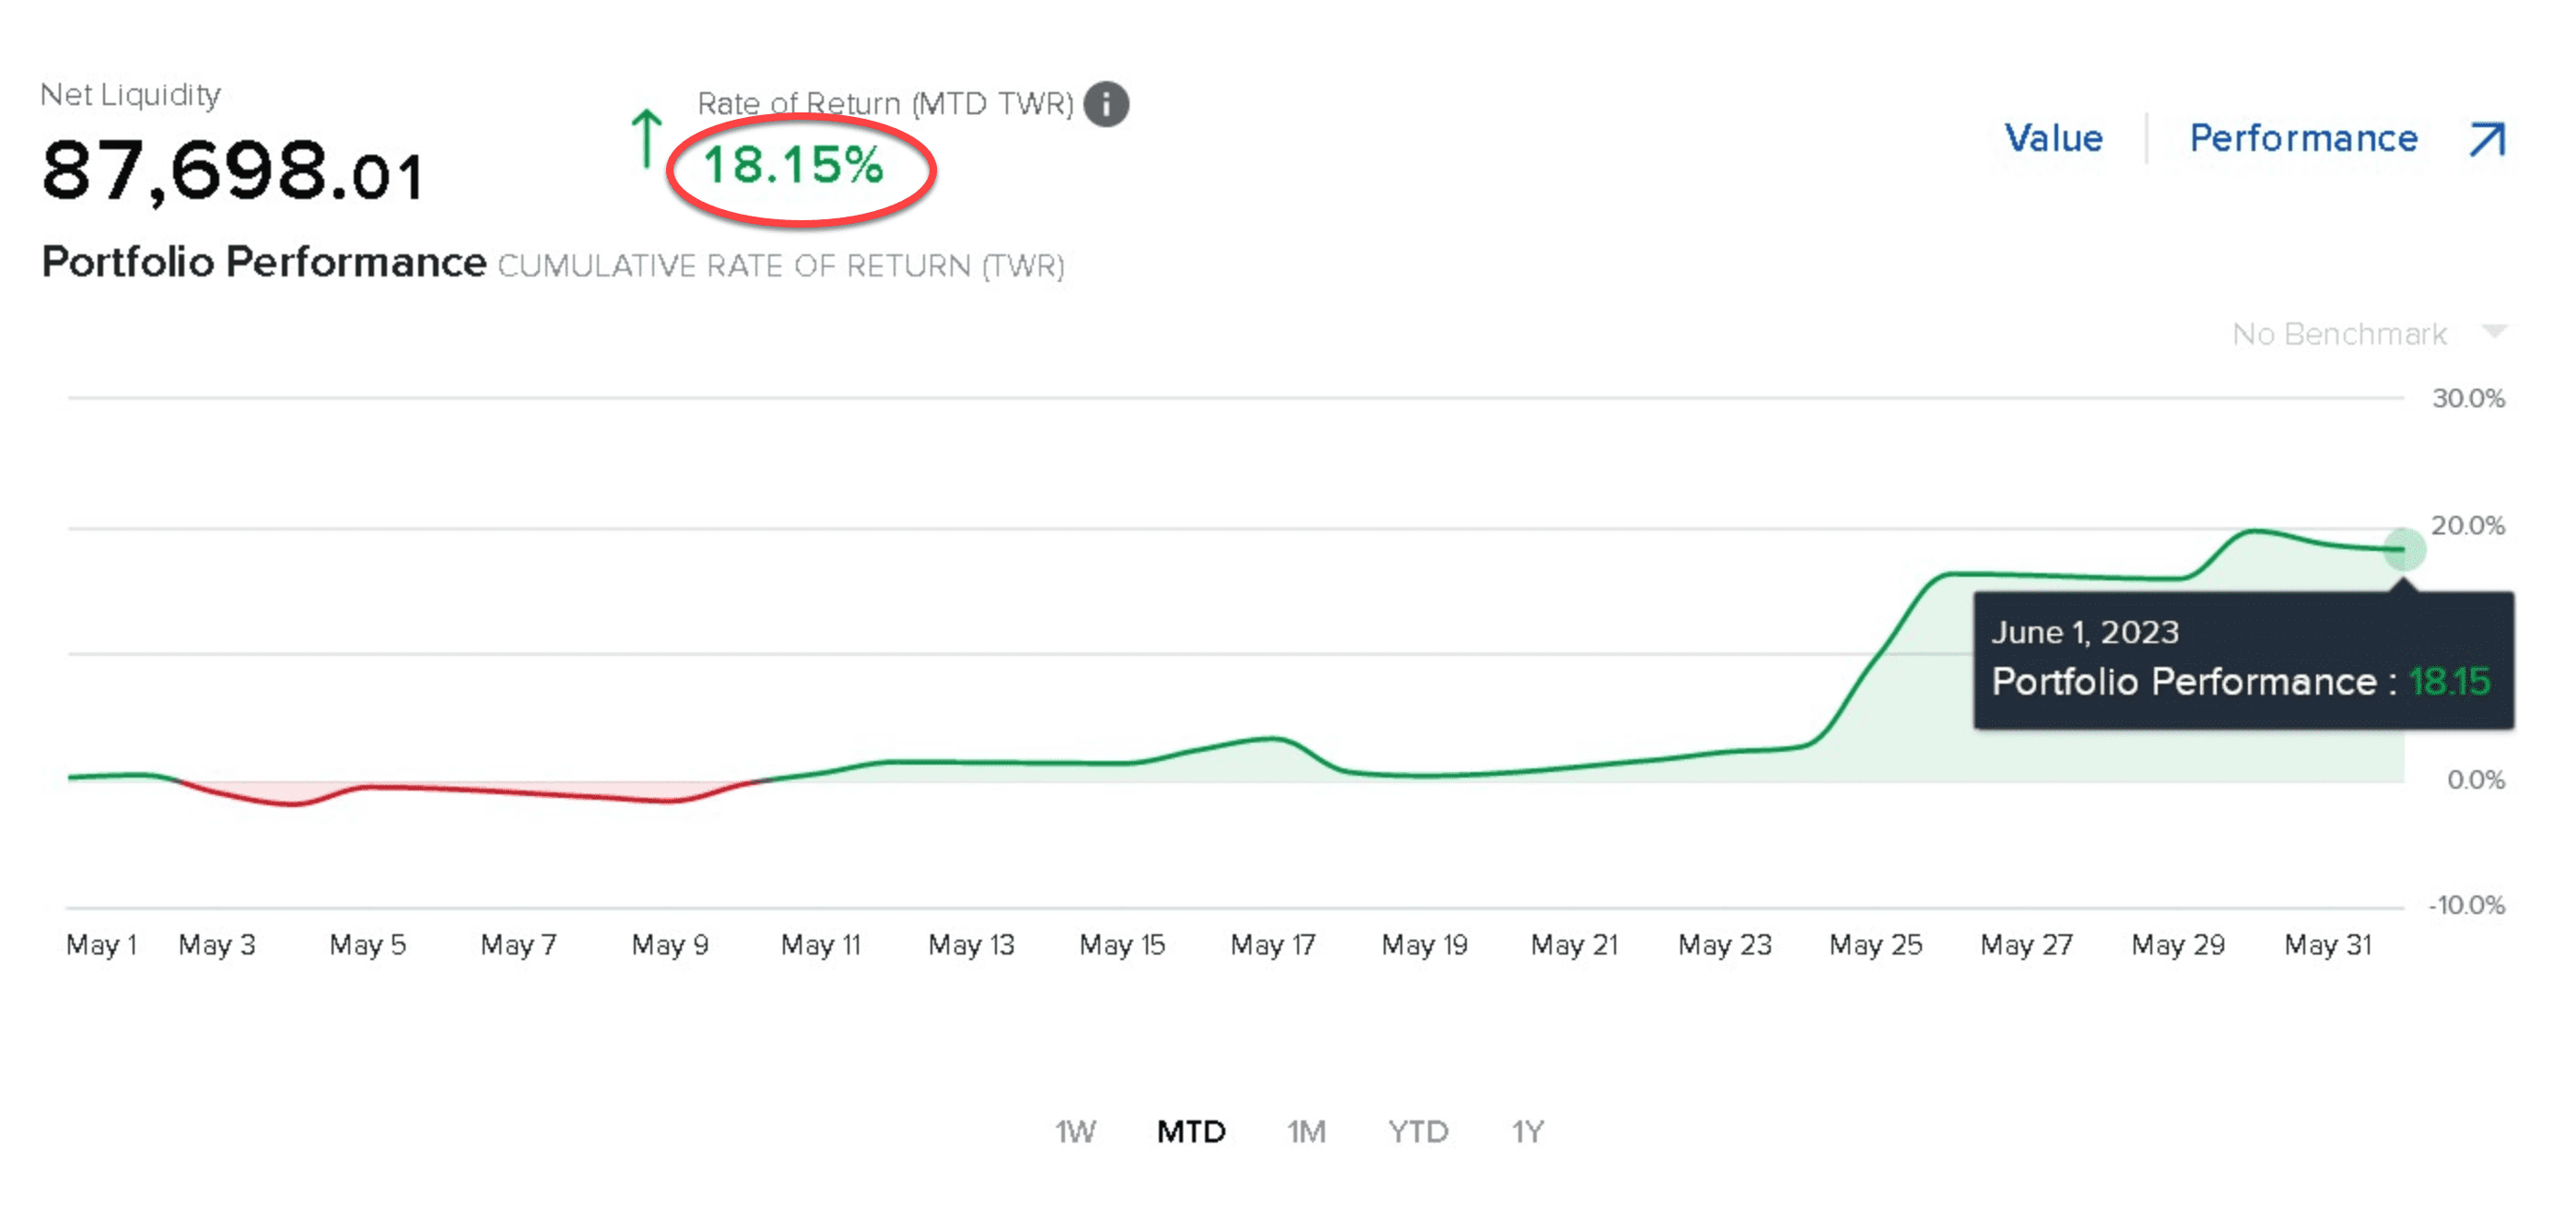
|

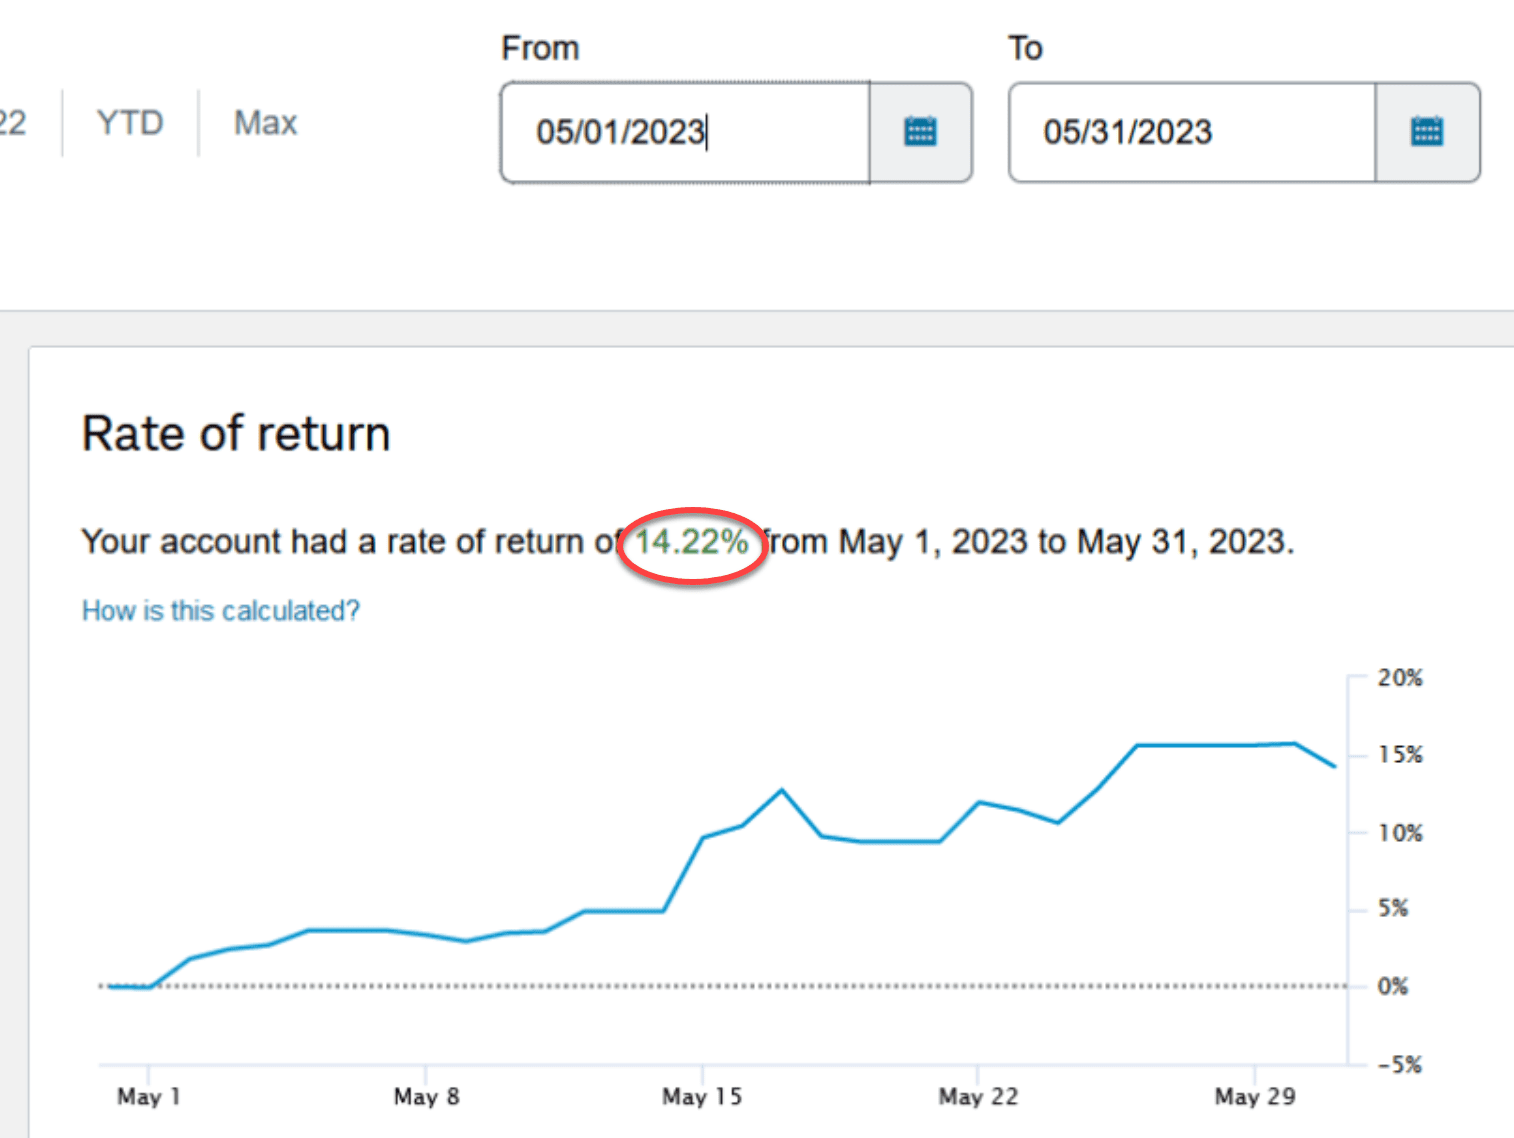
Peter S. was up 14.22%.

I'll have to ask them if they were in semiconductors while all the “valuation” guys were shorting NVDA and getting crushed.
By the way, if you're curious about what we're doing, start here on the new homepage:
We've also trained “The Boss” to answer any questions (it's in the lower right corner of the screen). Be warned that he's been a bit melancholy lately. Or better yet, talk to an actual person.
|
|
Disclaimer: The results listed herein are based on hypothetical trades. Plainly speaking, these trades were not actually executed. Hypothetical or simulated performance results have certain inherent limitations. Unlike an actual performance record, simulated results do not represent actual trading. Also, since the trades have not actually been executed, the results may have under (or over) compensated for the impact, if any, of certain market factors such as lack of liquidity. You may have done better or worse than the results portrayed.
Insert Image


Responses