What We Discovered After Unleashing Machine Learning on More Than 3,000 U.S. Stocks, ETFs and ADRs—and Running 1.2 Billion Backtests in Search of the Market’s Most Closely Guarded Secrets
Several months ago, my team and I invented a new research tool inside Portfolio Boss that changed the size of the problem we could attack.
We call it Strategy Mill.
For most of my trading career, building a strategy was painfully hands-on. If I wanted to test an idea on a stock, I had to program the rules, run the test, inspect the results and then do it all over again for the next symbol. I started writing trading strategies by hand in 1997. I know exactly how much work that can be.
Strategy Mill turned that old process on its head. I could copy and paste one symbol into the software, or I could paste thousands of them. Then machine learning could build possible trading strategies, test them, reject the failures and keep searching while the computers did the heavy lifting.
The first time I saw what that made possible, I had one of those bright ideas that was equal parts obvious and slightly insane.
Why not load every U.S.-traded stock and ADR in our eligible universe with a market cap above $1 billion, add every popular ETF, and send Strategy Mill hunting for the best trading strategies in the world?
Then why not trade those?
That sounds simple now. It did not sound simple at the time.
The largest project we had ever attempted like this covered about 400 symbols. That was already a serious research job. Now I wanted to jump from 400 to more than 3,000 stocks, ETFs and ADRs and attack the entire universe from four different directions.
The goal was not to find one spectacular strategy that might shoot straight up one year and scare the life out of you the next. I wanted to build an entire portfolio capable of producing high returns with extreme consistency. I wanted something smoother, stronger and more dependable than anything we had ever built before.
In other words, I was not looking for one lottery ticket.
I wanted to build the machine that could keep finding the best opportunities, spread the risk and turn a massive research advantage into a portfolio a real person could actually live with.
For approximately two months, we pointed Strategy Mill at that giant universe and let it run. We searched four separate edges across more than 3,000 symbols. Underneath those searches, the computers ran approximately 1.2 billion backtests.
It felt like a marathon.
The computers removed years of hand programming, but they did not remove the hard decisions. We still had to decide what to search, how to test it, what to throw away, what deserved a closer look and whether a gorgeous result was a genuine discovery or another beautiful lie manufactured by a very powerful machine.
And the research kept surprising me.
I was convinced that the great tech companies and the new generation of AI stocks would produce many of the biggest winners. After all, those were the companies getting the attention. Those were the stocks everybody wanted to own.
That is not what happened.
Some of the strongest results came from companies most investors have never heard of. Many of the businesses were downright boring. The patterns the computer discovered inside them were anything but boring.
By the time the mission was finished, our final historical portfolio simulation showed a 53.6% annualized return with a tiny 10.8% maximum drawdown and approximately 93% winning months. From April 2024 through the end of the test, it had not suffered a single losing month.
The 53.6% annualized return will grab your attention. It should. But the number I love most is the 93% winning months, because consistency was the mission from the beginning. I wanted strong gains without the kind of stomach-churning ride that makes a strategy miserable to trade.
Those figures show you where the mission ended. They do not tell you why this research matters, how we got there or how many seemingly brilliant strategies had to be killed along the way.
That is what this report is about.
If you stay with me, I am going to show you:
How Strategy Mill made a search this large possible, and why giving a computer more power also gives it more ways to fool you.
The four completely different edges we unleashed on the market, including nearly 50 traditional and proprietary indicators, ETF premium and discount relationships, transformed dark-pool data and Cyber Code that writes and evolves its own trading rules.
The multiple unseen-data exams we use to separate a strategy that may have found something real from one that simply memorized the past.
Why a strategy can look like a money-printing machine on a screen and still deserve the axe because of liquidity, capacity, impossible fills or hidden concentration.
How we compare strategies against one another so the final portfolio works like a well-synchronized team instead of a random pile of individual winners.
What we learned about rebalancing, the Dead Man’s Switch, real-world order execution and the last maddening steps required to manage an entire portfolio automatically.
And the biggest surprise of all: where the strongest strategies kept appearing after the computers had searched nearly the entire eligible U.S. market.
Along the way, I will show you the expensive mistakes that shaped this process, including a strategy that looked as though it would make me millions until real fills and trading costs turned it into a pile of crap. You will also see why a strategy that sailed through its first unseen test can still blow up when you finally open the last sealed year.
What follows is the field report from the largest research project in Portfolio Boss history, including what worked, what failed, what surprised me and what I believe you can take from it for your own trading.
So let us go back to the moment when the idea still sounded slightly ridiculous, the computers had not yet run a single one of those billion backtests and I decided to swing for the fences.
Two Months Earlier: Swinging for the Fences
The mission sounded simple when reduced to one sentence: search virtually everything in our expanded eligible U.S.-traded universe and find the strongest repeatable patterns the computer could uncover.
In practice, that meant working through more than 3,000 U.S.-traded stocks, ETFs and ADRs, including large caps, mid-caps, the comparatively small group of small caps that cleared our minimum standards, the S&P 500, the Nasdaq 100, high-beta stocks and every popular ETF in our research universe. The universe was 7.5 times larger than the one we had searched before. I deliberately set the standards high because better tools had given us the luxury of becoming much pickier.
Strategy Mill made a mission of this size possible. The easiest way to describe it is that it turns a computer into an automated strategy factory. I could copy and paste a large list of symbols, choose the research process, set the minimum requirements, press Start and let the machine work through the list while I did something else.
That does not mean we pressed one button and a perfect portfolio popped out two months later. Strategy Mill automated the repetitive labor that would otherwise make the project impossible. It launched the searches, built possible rules, tested them and filtered out results that failed our requirements. Instead of manually opening every piece of junk the computer produced, I could concentrate on the much smaller number that survived long enough to deserve human scrutiny.
And there was plenty of junk to remove.
When people hear “1.2 billion backtests,” they may picture us examining 1.2 billion finished trading systems one chart at a time. We did not do that, and unless medical science makes a rather dramatic leap in human longevity, I would prefer not to start. The 1.2 billion figure represents the enormous number of underlying strategy evaluations performed inside the larger searches. The computers could test possibilities at a scale no human research team could inspect manually, while the filters kept the output from burying us alive.
That filtering matters because most symbols do not hand you an obvious, durable pattern, and most combinations of trading rules are useless. Worse, a tiny percentage of useless rules will produce breathtaking historical results purely by accident. When you run a search this large, you should expect to find strategies that look like genius even though they are nothing more than statistical lottery winners.
The danger grows with the power of the machine. Faster computers let you search more possibilities, but searching more possibilities also gives the computer more opportunities to fool you. Strategy discovery therefore has two jobs: find the rare patterns that may be real, and build enough defenses to kill the accidental winners before anyone risks money on them.
For this project, I decided to swing for the fences. The original pass demanded extremely high returns in both the data used to build a strategy and data the strategy had never seen. I wanted hundreds of trades where possible, strong performance outside the development period and a strategy that improved dramatically on simply owning the underlying stock. Later, I would widen part of the review to examine candidates in the 30% to 40% annual-return range, but I began by asking the computers to look for monsters.
We did not conduct one giant undifferentiated search, either. We ran four separate hunts, each using a different source of potential market information.
The first searched nearly 50 indicators. That included the traditional names traders know, plus many indicators developed inside Portfolio Boss, including one that led us to a rather shocking discovery about Fibonacci retracements.
The second looked at ETF mispricing and unusual international information—the kind of strange relationship that can connect activity in a country fund with the future movement of a seemingly unrelated U.S. stock.
The third searched dark-pool and off-exchange information, where much of modern stock trading now takes place outside the familiar order books of the New York Stock Exchange and Nasdaq.
The fourth was Cyber Code, our evolutionary programming process that allows the computer to assemble and test its own trading logic from simple mathematical and logical building blocks.
Each edge searched the market differently. Each produced its own discoveries, false starts and surprises. Long before any strategy could reach the serious-candidate and final-selection stages, however, it first had to make it through a validation process designed around one uncomfortable fact:
Given enough opportunities, a computer can manufacture a beautiful lie.
The next step was learning how to tell those lies from an edge we might actually be willing to trade.
The Stories Your Brain Wants to Believe
A computer is not the only thing capable of manufacturing a beautiful lie. The human brain will do it for free, usually in a few seconds, and then congratulate itself for being logical.
Give us two facts that appear to fit together and we instinctively build a bridge between them. If the explanation sounds intelligent, includes a chart and comes from someone who looks like an authority, that bridge can feel as solid as concrete. Most of the time, however, nobody has bothered to check whether there is anything underneath it.
I learned to be suspicious of those bridges a long time ago. I programmed my first trading strategy by hand in 1997 using Perl, which will give some of the older programmers reading this a small nostalgic pain behind the eyes. Computers were slower, the tools were primitive and testing an idea took considerably more work than it does today, but the question was the same one I still ask now:
What actually happened every other time?
Not what should have happened. Not what makes a great headline. Not what a person with a large following confidently says will happen next. I want to know what occurred when the same basic conditions appeared in the past, over enough observations to mean something.
Consider the Baltic Dry Index. Every so often, someone notices that the index has fallen and draws a very neat line from lower dry-bulk freight rates to a weaker economy, then from a weaker economy to an approaching recession and finally from a recession to a falling stock market.
The story feels logical because every step appears to connect with the next one. It also gives the person telling it the aura of someone who has discovered a secret economic alarm bell while the rest of us were foolishly watching the S&P 500.
There is only one irritating little question: did it predict the stock market when the relationship was tested across history?
When I tested the idea, I found no useful predictive power for the stock market. For trading, that settled it. The chain from lower shipping rates to an approaching stock-market fall sounded clever, but it did not survive the test I cared about.
The second example is more recent. I saw an argument built around the falling price per token for using AI and large language models. The cost of using an LLM was declining, and the conclusion practically wrote itself: that must mean trouble for artificial-intelligence companies, so AI stocks should be heading lower.
Your brain can complete the story before you finish reading the article, but the stocks did the opposite and went straight up. A plausible direction of causation is not evidence that the predicted market move actually occurs. Sometimes the explanation arrives with such confidence that nobody pauses to look out the window and notice the market moving the other way.
The third example is the one that bothered me most because it challenged an idea traders have repeated for decades.
Fibonacci retracement levels are supposed to identify areas where a pullback may find support and create a buying opportunity. The concept has a mathematical pedigree, it looks impressive on a chart and enough traders repeat it that the idea begins to feel less like a hypothesis and more like a law of nature.
We built our own retracement indicator inside Portfolio Boss, and I was surprised by how often the machine selected it. After testing the relationship across approximately 27,000 trades, the evidence led me in the opposite direction from the conventional interpretation. Rather than treating that retracement area as the place to buy, we found it more useful as a place to sell.
I would have been perfectly happy if the accepted interpretation had worked. It would have saved us a great deal of testing and a rather strange adventure. But the computer does not care how many books have repeated an idea, how elegant the numbers look or how emotionally attached anyone has become to drawing the lines.
It simply counts what happened.
That gives us three different traps. The Baltic Dry story failed when I tested the trading inference across history. The falling LLM cost story ran into a market moving the other way in real time. And the accepted retracement rule went through a large internal test and came out pointing backward.
The conclusion is not that every market story is wrong. The conclusion is that before it has been tested, you do not know.
That uncertainty is where honest research begins. It also creates a practical problem, because testing thousands of symbols, multiple kinds of market information and an enormous number of possible rules is far beyond what any person could do manually.
Strategy Mill: The Automated Strategy Factory
That labor problem is where Strategy Mill changed the scale of what we could attempt.
For this project, we divided the universe into useful groups: mid-cap stocks, large caps, the S&P 500, the Nasdaq 100, qualifying small caps, high-beta stocks, ETFs and ADRs. That let me see not only whether an edge existed, but where the computer kept finding it—and where the search repeatedly came back empty.
The mid-cap list alone contained approximately 1,100 symbols. We ran four different edge searches for each symbol, which works out to roughly 4,400 primary strategy runs for that group.
That number needs to be understood correctly because one strategy run is not one little trading rule. Inside a run, the software may build and evaluate a huge number of possible strategies as it searches for rules that satisfy the requirements.
Each strategy run could contain a huge number of underlying strategy evaluations, and those internal evaluations are what drove the total research count to approximately 1.2 billion.
But pressing Start does not remove judgment from the process.
I still had to decide what universe to search, which edge to test, what data to use, how many trades I wanted to see, what return and risk requirements had to be cleared and what would disqualify an otherwise attractive result. After the computer finished, I still had to examine the survivors, compare them with the underlying stocks, question whether the apparent edge made sense statistically and look for reasons the strategy might be difficult to trade in the real world.
Strategy Mill did not replace the researcher. It gave the researcher a much larger shovel—and an automatic system for throwing most of the dirt back where it belonged.
Most of What the Computer Finds Belongs in the Trash
This may be the least glamorous part of strategy research, but it is one of the most important: most of what gets tested deserves to die quietly inside the filter.
Most searches died inside the filters, exactly where they belonged. Finding the useful pockets of the market meant digging through a mountain of symbols and rules that had nothing repeatable to offer.
The dangerous results are not always the obvious failures. A strategy that loses money from the beginning is easy to reject. The real trouble comes from a useless rule that happens to line up beautifully with the past and produces an equity curve smooth enough to make you begin mentally spending the profits.
Passing the filter only earned a strategy an interview. It still had a long way to go.
I generally want to see substantial trade counts—often hundreds of trades where the available history permits—because a gorgeous strategy built from a handful of lucky events tells us very little. The exact standard depends on the edge and the amount of history available, but the principle does not change: the fewer observations you have, the easier it is for luck to dress itself up as skill.
Strong performance in the data used to create the strategy is only the beginning. We also need to know what happened in data the computer did not use while building the rules, and then what happened in an additional sealed period after that. A strategy that cannot survive outside the period that made it look brilliant has not discovered the market. It has memorized its homework.
About 20 years ago, while beta-testing Project Lego for one of the original Turtle Traders, I learned that the objective was not to worship one heroic strategy but to assemble several strategies capable of working together. The scale of this project finally allowed us to pursue that lesson in a way I could not have imagined then.
After searching more than 3,000 symbols through all four edges, we ended up with 37 of the best strategies we could find.
That is why those 37 matter. They were not impressive examples selected from a presentation folder while the failures were hidden backstage. They were what remained after an enormous search produced far more reasons to say no than yes.
Before any of them could reach that final field, however, we had to understand what each research family was actually looking for and then force the survivors through the validation gauntlet.
We therefore ran four different hunts.
The first began with the most familiar raw material in trading: indicators.
Edge One: Nearly 50 Indicators and One Uncomfortable Fibonacci Result
The first hunt began with the raw material most traders already know. We searched nearly 50 indicators, including MACD, RSI, Stochastics, Bollinger Bands and on and on. We also searched many indicators that are unique to Portfolio Boss because earlier research gave us reasons to measure the market in ways that ordinary charting packages do not.
I think traders tend to fall into two camps here. One group collects indicators like golf clubs and keeps adding them to the bag, certain that the next one will finally fix the swing. The other group decides every indicator is useless because so many traders use them badly.
Both groups decide before the evidence arrives.
Inside Strategy Mill, an indicator is simply raw material. The computer does not care that traders have used MACD for decades, and it does not become impressed when an indicator has an exotic name. It tests whether the information can help form a useful rule on a particular symbol. Then it asks whether that rule survives enough trades and enough unseen data to deserve another look.
One indicator kept getting my attention. It was the retracement indicator we built inside Portfolio Boss.
That one already had a history. Fibonacci retracement levels are normally presented as places where a pullback may find support, which means traders are taught to look for a buying opportunity. We tested that idea across approximately 27,000 trades and found something very different. The retracement area was more useful as a place to sell.
That was not the answer I expected. It was simply the answer the trades gave us.
Now we had Strategy Mill attacking more than 3,000 symbols from four directions, and the same retracement indicator kept appearing in strategies that survived the early filters. The computer was under no obligation to respect the traditional Fibonacci story. It could use the information in either direction, or ignore it completely. Yet the indicator continued to show up.
That is one of my favorite things about systematic research. The name printed on an indicator does not get to tell the computer what it means.
If generations of traders call a level “support,” the machine does not salute and place a buy order. If the evidence says the same measurement is more valuable as an exit, the machine is perfectly happy to offend several decades of trading books. It has no guru to protect, no followers to impress and no emotional attachment to the lines on the chart.
With nearly 50 families of information on the table, the familiar name on an indicator meant nothing. The market got the final vote.
Edge One started with information from the stock’s own chart. Edge Two became stranger because the useful information could come from a completely different ticker.
Edge Two: When an ETF’s NAV Mispricing Predicts Another Stock
Most traders study a stock as though it lives on an island. They look at its price, volume, earnings, news and perhaps a few indicators calculated from its own history.
The market does not work that way. It is closer to one enormous piece of plumbing, with money, information and risk moving through countries, industries, funds, currencies and individual companies all at once.
The second hunt asked a much more interesting question. Can information appearing in one ticker help us anticipate what happens next in a completely different ticker?
The information we searched was ETF mispricing, which means the premium or discount between an ETF’s market price and its net asset value. That is the mispricing. The unusual part was not the definition. It was how narrowly Strategy Mill could connect that information with the future movement of another security.
We searched every popular ETF in our research universe. The names that came up over and over were often iShares country ETFs, which are owned by BlackRock. Each one gives us a U.S.-traded window into a basket associated with a particular country or market.
The obvious idea would be to look at an ETF’s premium or discount and trade the ETF itself. Strategy Mill went much farther. It tested whether that same mispricing could predict a move in a different stock.
The stock did not need to be inside the ETF. It did not even need to look related at first glance.
The Hong Kong ETF produced several interesting examples involving microchip companies. That one is not difficult to picture. Hong Kong sits inside a much larger Asian manufacturing and supply-chain network where semiconductors and electronics matter enormously. Pressure showing up in the country ETF can reveal something moving through that network before it becomes obvious on the chart of a particular chip company.
Other relationships were far stranger. We would see a useful connection and have no clean little story for why it existed.
That does not bother me as much as it bothers some traders.
Jim Simons built Renaissance Technologies around the idea that the market could contain repeatable statistical patterns that were difficult to explain. Renaissance’s Medallion fund is widely considered the most successful hedge fund ever, and published accounts of the firm describe signals that often made little intuitive sense. What mattered was whether a pattern was statistically significant, whether it remained consistent, and whether it held up in data the search had not used to find it. If it passed those tests, they were willing to trade it without first inventing a perfect story.
I feel the same way.
Millions of people and institutions buy and sell for millions of different reasons. A pension fund is rebalancing. A market maker is managing inventory. A company is hedging currency exposure. An index fund is handling flows. A trader in another country is reacting to information that has not reached your screen yet. All of that disappears into the internal plumbing of the market and eventually comes out as price.
An ETF premium or discount can pick up pressure somewhere inside that plumbing. The useful question was simple. Did the relationship repeat often enough to matter, and did it keep working after we took away the data used to discover it?
That is what made Edge Two so fascinating. It showed that the most useful information about a stock may not come from that stock at all. Sometimes the clue is hiding in a BlackRock country ETF on the other side of the market.
The next edge went below the visible market altogether. Instead of watching another public ticker, we started with trading activity that took place away from the lit exchanges.
Edge Three: The Dark-Pool Data That Looked Random Until We Changed It
The phrase “dark pool” sounds as though a group of villains in black capes are trading stocks in a basement. The truth is less theatrical, but it matters a lot more than most retail traders realize.
By 2025, more than half of U.S. NMS share volume was being reported away from the lit exchanges. FINRA’s 2026 Industry Snapshot puts the OTC share at 50.6%, up from 47.0% in 2024 and 44.0% in 2023.
That is not a side alley of the stock market anymore. It is the majority of the shares.
There is a very practical reason for that shift. Imagine a fund needs to buy or sell a few million shares. If it hangs the full order in the front window of a lit exchange, high-frequency traders can detect the footprints, jump in front and start picking the order apart. Every share that moves against the fund makes the remaining position more expensive to complete.
So large traders looked for ways to place orders without advertising the whole plan. Dark pools and other off-exchange venues became part of that internal plumbing. At the retail end, payment for order flow sent another enormous stream of orders to wholesalers instead of directly to the public exchange book.
The ordinary chart still shows the completed trades. What it does not show is the full buying or selling intention before those trades happened. That hidden pressure is what made the data so interesting to me.
For this research, the raw material was FINRA short-sale volume from trades reported through its off-exchange facilities. The obvious first move was to look at short-sale volume as a percentage of the day’s volume and ask whether a high or low reading predicted what happened next.
The answer was no. As a raw percentage, the data was no better than randomness. Strategy Mill could still manufacture beautiful historical strategies from it, because a powerful computer can always find a few lucky combinations. But those strategies failed far too often when we moved them into data they had not seen. They were classic overfit garbage.
I had seen the same thing with another experiment. We once fed machine learning the daily percentage gains and losses of different stocks and asked it to uncover hidden relationships. That sounds promising. There are thousands of stocks moving together and apart every day, so surely the machine ought to find some secret code in there.
Instead, it found noise, and the raw dark-pool short-sale percentage looked much the same. Interesting data, wonderful story, no dependable edge.
Then we changed the data before asking the machine to search it.
We developed a special data-conversion technique that transformed the raw short-sale information into a different measurement. The conversion itself stays proprietary. What matters is what happened next. The randomness began to disappear, and Strategy Mill started finding statistically significant edges that could survive the unseen-data tests.
That changed everything because the edge was not sitting in the obvious number that anybody could download and divide on a spreadsheet. Short-sale volume divided by daily volume did not work. The useful information appeared only after the special data conversion gave the machine a better way to see what was happening underneath the surface.
This is one of the reasons I love machine learning when it is used correctly. It does not rescue bad data by magic. We proved that twice. But when you transform the right market information in the right way, the same machine that was producing random junk can suddenly begin finding something real.
Edge Three began with activity most traders never examine, went through a period where it looked completely useless, and became valuable only after we changed the lens.
The fourth hunt went one step further. Instead of giving the computer a finished indicator or converted dataset, we handed it primitive pieces of code and let it evolve its own trading rules.
Edge Four: Cyber Code and the Power of Stupid-Looking Rules
I call the fourth hunt Cyber Code. It is our evolutionary programming process, which is a fancy way of saying the computer builds trading rules, tests them, kills the weak ones and keeps breeding from the stronger ones.
Cyber Code is also the foundation of the ETF mispricing and dark-pool edges. Those unusual datasets provide the raw information. Cyber Code is the engine that turns that information into testable trading rules and searches for the combinations that may contain a real edge.
The funny part is how primitive the building blocks can be.
Cyber Code can work with addition, subtraction, multiplication, greater than, less than, AND, OR, days of the week and other simple instructions. None of that sounds like artificial intelligence. It sounds like the first week of a programming class.
Yet simple code can lead to amazing discoveries.
Take a rule as basic as this: today’s close is greater than today’s open. Believe it or not, that can contain useful information about when to sell a swing position. The same is true of a calendar rule such as selling on Tuesday. There are strategies where one primitive line of code does more useful work than a spaghetti bowl of indicators covering the whole screen.
That is what I sometimes call indicatorless trading. There may be no RSI, no MACD and no tunable parameter at all. An RSI rule such as “sell when RSI is greater than 80” has a parameter, which is 80. Even “sell on Tuesday” has a parameter because the computer could choose any day from Monday through Friday.
A truly parameterless Cyber Code rule might say, “Place a sell limit order if today’s close is greater than today’s open.” There is no adjustable number or day of the week to optimize. The condition either happened or it did not. It is almost comically simple, and that simplicity can be a strength.
Here is the easiest way to picture the evolutionary process. Imagine Cyber Code begins with 256 little programs. Most are nonsense, which is exactly what you would expect when primitive instructions are combined in different ways.
The computer tests all 256, scores them and cuts the bottom 128. The stronger half contributes to the next generation, with pieces recombined and mutated to create new candidates. Then the machine tests the new population and cuts it again. Run that cycle for roughly 100 generations and the computer can explore an enormous amount of code without asking a human being to program every idea by hand.
The really important part is the score.
In evolutionary programming, that score is called the fitness function. The machine has no opinion about what makes a good trading strategy. It chases whatever we reward, which means a bad fitness function can breed exactly the wrong animal at astonishing speed.
CAGR is the first fitness function most people choose. CAGR is compound annual growth rate, and it answers the exciting question: how fast did the account grow? Amateurs usually stop there because it is the number that makes the eyes get big.
Then they discover drawdown.
Maximum drawdown tells you how ugly the trip became. If a $100,000 account falls to $50,000, you just experienced a 50% drawdown. In the hedge-fund world, a loss like that can shut the fund down. It does not matter how wonderful the CAGR looked in the brochure if investors have already pulled their money and the business is dead.
The more trading experience you get, the more you care about making the drawdown smaller.
Profit factor is one of my favorite fitness functions. It is gross winning dollars divided by gross losing dollars. A profit factor of 2 means the strategy historically made about $2 in gross profit for every $1 it lost. That number reflects both how often the strategy wins and how much larger the winners are than the losers.
Profit factor travels well. I can use it on a volatile stock, a bond strategy, a long-term strategy, a swing strategy or an intraday strategy and still understand what I am looking at. For the kind of swing trading we were doing in this project, I like to see a profit factor around 2 before costs.
Average profit per trade helps tell us whether the strategy can survive contact with a broker. I generally like to see at least 1% per trade on average for a swing strategy with roughly a one-week holding period. That average includes the winners and the losers. If the expected profit on each trade is microscopic, commissions, spreads, slippage and market impact can eat the whole thing before it reaches your account.
Simplicity is another fitness function I care about enormously. We penalize bloated code because Occam’s razor is incredibly important in strategy building. If two strategies produce similar results and one needs twelve rules while the other needs one, I would much rather investigate the one-rule strategy. Every extra condition gives the computer another chance to memorize an accident from the past.
Some of the unusual edges in this project came from only one line of code. That is not a weakness. It can be a sign that the machine found a clean relationship instead of building a Rube Goldberg contraption around historical noise.
So the researcher still has a major job. We decide whether Cyber Code should reward CAGR, low drawdown, profit factor, average profit per trade, trade count, simplicity or some combination of them. The machine then does the tireless evolutionary work.
That power cuts both ways. Cyber Code can discover a useful one-line rule no human would have bothered to test. It can also manufacture an incredibly persuasive lie by fitting the past more perfectly than any human could manage by hand.
That is why every candidate had to walk through three doors before I was willing to take it seriously.
The Three Doors a Candidate Had to Survive
An overfit strategy can have a beautiful equity curve, a clever rule and a perfectly reasonable explanation. If the computer gets enough attempts, it will eventually find something that fits the past like a custom-made suit.
The only way to find out whether we discovered an edge or a very expensive hallucination is to take away the answer key.
Door One: The Construction Workshop
Door One is the portion of history where the computer is allowed to build. Researchers call it in-sample data.
Inside this workshop, Strategy Mill can assemble a rule, test it, change it and test it again. If Cyber Code is involved, the stronger programs keep influencing the next generation. This is where the strategy learns, which also means this is where it can memorize every accident and oddball event in the data.
A great result inside the workshop is encouraging, but it is not impressive by itself. The computer was allowed to study those answers while it was building the rule. I have seen enough perfect in-sample charts to know that some of them are no more intelligent than a student who stole the answer key.
Door Two: The First Unseen Exam
Before the strategy leaves the workshop, we freeze the rules. Then we expose it to a portion of history it was not allowed to see while it was being built. I generally set aside about 20% for this first out-of-sample test.
Now the strategy has to take an exam it could not study.
If it falls apart, we do not send it back into the workshop for a little cosmetic surgery. That would leak the answers into the rule and ruin the entire purpose of the test. We cut it.
I learned the importance of this the hard way about 20 years ago when I was part of Project Lego, a beta group for manual strategy-design software created by one of the original Turtle Traders. He became a mentor to me. We had to program strategies by hand back then because none of this machine-learning automation existed.
The Turtle lessons were enormously valuable, but out-of-sample validation was not taught as the center of the process. Leaving roughly 20% of the data unseen felt more like an afterthought.
What happened later was ugly. My mentor overfit the past, handled the money badly and eventually blew up his own account and client accounts. His life followed the trading downhill. From where I stood, the cascade began with trusting strategies that looked wonderful in optimized historical data but had not been forced to prove themselves on enough unseen information.
Watching that happen burned this lesson into me. I do not care how attractive the equity curve looks. The strategy does not get to trade real money merely because it did a fantastic job describing yesterday.
The first unseen exam kills a tremendous amount of garbage, but a search of this size creates another problem. Imagine giving the same exam to a stadium full of students and choosing only the highest scores. A few students will guess unusually well. They did not have the answer key. They were simply lucky.
After 1.2 billion backtests, luck can sneak through the first unseen exam too. That is why we added another door.
Door Three: The Sealed Second Exam
The third door is a second period the strategy has never seen. I call it super out-of-sample data. The easiest way to understand it is to imagine building a strategy, locking it in a drawer for a year, and then coming back to see what happened while you were gone.
I once built a strategy on Palantir that looked terrific. It showed an annual return above 100% in the construction data. Then it produced an annual return above 100% in the first out-of-sample period too.
It looked like a monster.
Then I unblinded the final year of totally unseen data. The strategy went straight down. It blew up.
Three Doors of Validation
That experience was painful, but it was also incredibly valuable. The final year showed me something the first two periods had missed, and it showed me before the strategy could do the same thing with real money.
This second layer becomes especially important with newer stocks because there is less history for the computer to work through. Palantir is a relatively young public company compared with a stock that has traded through several decades of booms, crashes, rate cycles and market regimes. With less history, it is easier for a lucky relationship to look permanent.
Today I want at least 10 years of history before I take a strategy seriously. As the historical record gets longer, I see fewer strategies fool the first out-of-sample test. We still use the second sealed period every time because modern computers are powerful enough to overfit the past in ways that look frighteningly real.
The three doors are not paperwork. They are the reason I can cut a Palantir strategy showing more than 100% annual returns and sleep better afterward.
I saw what overfitting did to my mentor, his clients and his life. I do not want that happening to you. I certainly do not want it happening to me or anyone who trusts Portfolio Boss.
For the first hunt, I made the workshop and the first unseen exam especially unforgiving by asking the computer to search for returns that most traders would consider extreme.
Swinging for the Fences: The Original 40% Hunt
I started with a 40% annualized-return hurdle in both the construction data and the first unseen test. I was swinging for the fences, and 40% sounded like the right place to look for home runs.
It worked a little too well. The hurdle was so high that I did not have enough candidates for the kind of final review I wanted to run.
So I opened a second lane from 30% to 40%. I did not go below 30%.
Years ago, our cutoff was 20%. This project was different. We were searching more than seven times as many symbols, which gave us the luxury of being far more selective. Frankly, neither I nor our clients are looking for strategies below 30% when there are so many stronger candidates available. We are looking for genuinely attractive annual returns.
That return hurdle was only the ticket into the next round. Every candidate still had to survive the unseen data, produce enough trades, improve meaningfully on owning the same stock, and make sense in the real world.
With that larger field in hand, I started looking at where the best candidates were actually coming from.
Field Reports From the Search
Different parts of the market gave us very different answers. Mid-caps kept producing interesting candidates. Large caps were easier to trade but harder to impress me with. Small caps looked tempting until I pictured the actual orders. ETFs and ADRs had their moments, but this was a tough competition.
Mid-Caps: The Search Kept Finding Something Interesting
For this project, I defined mid-caps as companies worth between $2 billion and $10 billion. That gave us more than 1,100 symbols with a combined market value of about $5.5 trillion. This was not some tiny back alley of the stock market. It was an enormous hunting ground.
Four primary research hunts across those 1,100-plus symbols produced roughly 4,400 primary strategy runs. Once all the additional passes were counted, the mid-cap universe alone accounted for about 18,000 strategy runs.
And it kept giving us interesting material.
Quite a few historical simulations landed in the 50% to 60% annualized-return range, with a smaller group reaching into the 70% to 80% area. But the part that kept pulling me back to the screen was the difference between the strategy and the stock underneath it.
The stock itself might have spent years chopping sideways and going nowhere. Then I would lay the strategy curve beside it and see a much smoother climb. The stock was ordinary. The strategy had changed the entire historical experience.
Of course, a beautiful curve is useless if the stock cannot handle the orders. Some mid-cap candidates traded comfortably. Others did not have enough dollar volume for the scale I wanted. Those got cut. I wanted the upside of the middle market without creating an exit problem for ourselves later.
Large Caps: More Room, One Big Trap
Large caps pulled me in for a completely different reason. They have room.
These are the companies that can absorb much larger orders without one Portfolio Boss trade becoming the main event of the afternoon. Liquidity was better, the names were familiar, and some of the strategy curves looked terrific.
Fewer large-cap candidates cleared the original 40% hurdle. More started showing up when I reviewed the 30% to 40% range.
Then I asked the question that ruined a lot of otherwise gorgeous charts: How much of this return came from the strategy, and how much came from owning a stock that was already a monster?
Many large companies had tremendous runs after the 2009 market bottom. A mediocre timing rule could climb aboard one of those winners and take credit for the whole ride.
That is why I compare a single-stock strategy with buy-and-hold of the exact same stock over the exact same period. If simply owning the shares did almost as well, the strategy had not earned much applause.
Quick Portfolio Boss tip: Portfolio Boss calculates a score for both the strategy and the underlying symbol. As a fast first check, I want the strategy’s score to be at least double the score of the stock itself. That 2-to-1 gap lets me see very quickly whether the strategy is adding real alpha or simply hitching a ride on a stock that has been rallying like crazy.
Large caps solved a big part of the liquidity problem. They also taught us to make sure the strategy was producing the edge instead of borrowing a great stock’s report card.
Qualifying Small Caps: Temptation Meets the Exit Door
I expected the small-cap search to produce fireworks. I pictured strategies showing 100% or even 200% annual returns.
That parade never arrived.
We had already removed every company worth less than $1 billion. That cut out the penny-stock junk where a backtest can look amazing until a real order hits a paper-thin order book.
Even above $1 billion, liquidity became the deal killer. One client once told me he did not want to buy 5,000 shares of a small company because it felt less like a trade and more like a hostile takeover. I agreed with him.
If your order takes up most of the available liquidity, the entry is only the beginning of your problem. You still have to get out. A lot of traders never think seriously about the order book until it teaches them a very expensive lesson.
The remaining small-cap candidates were tempting, but they were not practical for the scale we were building. So small caps got the axe. Not one survived into the final 37.
ETFs: Respectable Was Not Enough for This Mission
ETFs presented almost the opposite experience.
I expected them to bring useful qualities to the search. Many of the ETFs we tested were liquid, familiar and capable of giving exposure to broad markets, sectors or themes without depending on one company.
Several produced respectable research results. But respectable was not enough in this competition. Many missed the 30%–40% individual-return band, and others could not improve the portfolio enough to beat the stronger candidates fighting for the same limited space.
A lower-return ETF strategy may be perfectly useful for a portfolio with a different mandate. This mission began by swinging for the fences and then looked for candidates capable of improving a very demanding combined result. “Perfectly respectable” was not necessarily enough to earn one of those slots.
There was also a separate role for ETFs in the research. Portfolio Boss can use a condition derived from a country ETF as information for trading an entirely different stock. The ETF need not be the traded security. An ETF could therefore contribute valuable information even if trading it did not produce a strategy strong enough for this particular candidate pool.
ADRs: A Few Made It Interesting
ADRs, or American Depositary Receipts, allow shares of companies from other countries to trade in the United States. Taiwan Semiconductor, ticker TSM, is one of the best-known examples.
The ADR search produced a few decent candidates, but not many. By the time I finished the unseen-data testing, benchmark comparisons, liquidity checks and final portfolio review, none of them had earned a place in the final group.
They had their shot. The stronger candidates simply beat them.
A Great Strategy Can Still Be a Bad Teammate
Finding a great strategy by itself was only half the job.
Imagine two strategies with impressive annual returns and attractive drawdowns. Put them together, though, and they may lose during the same ugly stretches or pile into the same kind of market risk. The second strategy looks wonderful on its own, but it does almost nothing to make the portfolio smoother.
Every serious candidate now had to answer two questions. Is this a strong strategy by itself? And does it make the whole group better?
A strategy could beat simply owning that same company’s shares and still fail the second question. Maybe another candidate already traded the symbol. Maybe both struggled at the same time. Maybe it used capital without giving us enough diversification in return.
We were no longer collecting pretty backtests. We were building a team.
The Final Round Started With 65 Strategies
Let me quickly bring the numbers back into focus. After the giant search and all the individual testing, I had narrowed the field to 65 serious strategy candidates. Those were strategies, not 65 stocks and not a finished portfolio. The same stock could appear more than once because different research hunts could find different rules for it.
Making the 65 meant a strategy had reached the final interview. It had not gotten the job yet.
This was the point where we stopped judging every candidate one at a time and compared them at the portfolio level. We use a mathematical matrix for that job.
The word matrix sounds more mysterious than the basic idea. Imagine we have 50 strategies. Put the same 50 strategies across the top and down the side of a square grid. That gives us 2,500 squares. Every strategy is compared with every other strategy so we can see which ones work together in harmony and which ones keep bringing the same problems to the party.
I am not going to publish the exact proprietary formula, but its job is easy to understand. It helps us find the combination that produced the smoothest overall ride without stripping away the return we worked so hard to find.
Every Strategy Compared With Every Other Strategy
The matrix gave me a ranking. I still had to make the final decisions.
Why 28 More Had to Go
The first cuts came down to liquidity and future capacity. A strategy could have beautiful numbers, but if I could see us outgrowing the stock, it was gone. I would rather cut a good-looking strategy today than discover later that our own success made it difficult to trade.
Then I dealt with duplicate symbols.
Different inputs do not make the underlying company different. Suppose two strategies both trade the same stock. One uses indicators and the other uses dark-pool data. Then the company reports terrible earnings and gaps down 25% the next morning. Owning it through two strategies did not reduce the risk. It increased our exposure to the same surprise.
So when more than one strategy traded the same symbol, I asked two things. How did each strategy rank against the rest of the field? And how well did each one work with the other strategies in the portfolio?
The higher-ranked strategy with the better portfolio fit won. The duplicate went away.
That is how I cut 65 serious candidates down to the final 37 strategies. The 37 were the final roster. How many would be selected and traded at one time comes later.
My goal was a smooth trading career with fewer headaches. I wanted large gains, but I did not want gains so wild that every week felt like a trip to the emergency room. Volatility is a double-edged sword. It can make the upside exciting and the downside unbearable, which is exactly what the next part of the research exposed.
What the 80/20/Zero Result Actually Meant
Here is the result without the fog. Of the final 37 strategies, roughly 80% traded mid-cap stocks, roughly 20% traded large-cap stocks, and none traded small caps.
I did not begin by telling the computer to favor the middle of the market. That is simply where most of the survivors came from.
The result makes sense when you think about how the biggest hedge funds operate. They have billions of dollars to put to work, so they compete heavily over the largest and most liquid companies. Those stocks can absorb enormous orders, which is exactly what the giant funds need. It also means armies of smart people with expensive data and powerful computers are fighting over the same ground.
Mid-caps can occupy a very useful middle. Many are liquid enough for the scale we want, but they are not always large enough to matter to a fund that needs to move hundreds of millions or billions of dollars. That can leave more room for traders like us to find something useful.
The 80/20/zero result changed where I wanted Portfolio Boss to keep digging. The middle of the market had produced far more than its share of the winners.
The Final Cut
Then I placed some of those mid-cap strategies next to the stocks they traded, and the difference was so dramatic that it reminded me of an old fairy tale about spinning straw into gold.
The Rumpelstiltskin Effect
In the old fairy tale, Rumpelstiltskin spins straw into gold. Some of these mid-cap strategies gave me the stock-market version of that picture.
The company itself could be painfully boring. Its shares might chop sideways for years, rally, give the rally back and leave a buy-and-hold investor with very little to show for all that waiting. Then I would put the strategy beside the same stock over the same dates and see a completely different ride.
The computer had not changed the company. It had changed our exposure to it. The rules decided when to get in, when to get out and when to leave the stock alone. That timing could turn an ordinary stock chart into a much smoother historical strategy curve.
This is why the comparison has to be against the same stock. If I compare a mid-cap strategy with the S&P 500, I can tell you which one happened to win over that period. If I compare the strategy with owning the exact same mid-cap stock, I can see what the timing rules actually changed.
Sometimes the stock went through long dead zones while the strategy stayed out of the way. Sometimes the strategy caught a swing and handed the shares back before the next ugly decline. Entry by entry and exit by exit, the rules created a historical path that barely resembled the experience of owning the company continuously.
That is the heart of the Rumpelstiltskin Effect. The companies can be boring. The patterns and edges we discovered inside them are anything but boring.
For a market timer, boring can be wonderful. I do not need every company to become the next Nvidia. I need repeatable behavior that gives the strategy a chance to enter when the odds are attractive and leave when they are not. A dull business can still produce a fascinating trading pattern.
There is another benefit hiding in that result. Instead of building a lineup dominated by AI companies that became enormous after performing so well in the past, the final group contains plenty of ordinary businesses. Who knows what happens next? AI may keep rocketing higher, or that heavy concentration may create giant risk someday. I would rather not make the whole portfolio depend on one crowded story.
That matters because yesterday’s winners have a sneaky way of becoming today’s largest weights. If the same handful of AI companies dominates the indexes, dominates investor attention and then dominates a trading portfolio too, one reversal can hit several supposedly separate holdings at the same time. The boring names give us another place to look for edge.
The Rumpelstiltskin Effect
Large caps exposed the mirror-image problem. Sometimes the gold was already in the stock, while the strategy tried to take the credit.
The Large-Cap Buy-and-Hold Illusion
Many giant companies have had extraordinary runs since the market bottom in 2009. Buying them, sitting still and doing practically nothing could make a person look like a genius.
Now attach a timing strategy to one of those rockets. The strategy may show a wonderful annual return, but how much did the rules actually add? A mediocre rule can climb aboard a fabulous stock and later act as if it built the engine.
This fooled a surprising number of otherwise attractive candidates. The equity curve looked great, the annualized return looked great and the company name was one everybody recognized. Then I put buy-and-hold of the same stock beside it and discovered that the underlying shares had already done most of the heavy lifting.
That is why I compare every single-stock strategy with buy-and-hold of the exact same stock over the exact same dates. Comparing an Nvidia strategy with the S&P 500 may look impressive, but the tougher question is whether the strategy improved on simply owning Nvidia.
I want the rules to earn their keep. Maybe they produce a higher return. Maybe they deliver a similar return with a much smaller drawdown. Ideally, they improve both. What I do not want is more trading, more complexity and more opportunities for execution problems in exchange for a result that barely beats sitting on my hands.
Drawdown is especially important in this comparison. A timing strategy may earn its place even when the final return is similar if it avoids a large part of the stock’s worst decline. That can make the strategy far easier to hold through the next bad market. But if the return and the drawdown are barely different from buy-and-hold, the extra machinery is not doing enough work.
This screen killed some gorgeous backtests. Good. I would rather lose a pretty chart than give the strategy credit for a return the stock had already produced.
Large caps still had one enormous advantage. They could absorb much larger orders. The companies were familiar, the markets were deeper and the exits were generally easier. The challenge was finding a rule good enough to beat a stock that had already been one of the market’s biggest winners.
That made the mid-cap discoveries even more interesting. Those boring stocks had very little glamour to lend us. When the strategy looked dramatically better, the rules were doing visible work.
Then came the next real-world question. Even if the rules were excellent, could the stock handle the money?
Capacity: The Question the Man in the Expensive Suit Could Not Answer
Years ago, a guy showed up at a party at my house in Newport Beach dressed to the nines. Expensive suit, fancy shoes, the whole production. He told me he worked for a local hedge fund and that his main job was bringing money in the door.
So I asked him a simple question.
“What is the capacity of the fund?”
He had no idea what I meant.
That told me the guy was full of shit. If your job is bringing money into a hedge fund, you had better know how much money the strategy can handle before additional capital starts crushing the returns.
Capacity sounds technical, but the basic math is easy. A stock trading 100,000 shares a day might sound liquid. At $10 a share, that is only $1 million in daily dollar volume. At $100, it is $10 million. At $1,000, it is $100 million.
Same share count. One hundred times as much money changing hands.
That is why I care about dollar volume, the bid-ask spread, the depth of the order book and what happens when several people need the exit at once. Market capitalization alone does not answer any of that. A company can be worth billions and still trade like a screen door on a submarine.
Average daily volume is only the first glance. I also want to know how much stock is sitting near the current bid and offer, how wide the spread becomes when volatility jumps and how quickly the order book refills after somebody takes the available shares. A calm afternoon can make a thin stock look friendly. Bad earnings the next morning can reveal how little liquidity was really there.
Entries and exits matter differently too. A patient entry can sit below the market and wait for somebody else to sell into it. An exit may arrive after a gap, a halt or a sudden rush for the same door. If the strategy needs patience on the exact morning when everybody else needs cash, the backtest has skipped the hardest part of the trade.
I was also thinking years ahead. A stock may be easy for one account to trade today and become a headache when more members and more capital follow the same strategy. I would rather cut a borderline candidate now than let our own growth break it later.
Capacity is ultimately a portfolio question. It depends on the least-liquid stock, the size of each position, how often the strategies trade, whether several signals arrive together and how quickly the money has to move. Thirty liquid stocks do not rescue one tiny position that becomes impossible to exit when the market turns.
This was also why I kept one selected strategy per symbol. Two different edges on the same stock may look like two strategies on paper, but an earnings disaster, trading halt or ugly overnight gap still sends both of them toward the same exit door.
If the indicator search and the dark-pool search both found a strategy on the same company, I kept the one that ranked best and worked most smoothly with the rest of the group. Different code does not create a different company underneath it.
Removing those obvious duplicates helped. It still left a larger problem. Different stocks can depend on the same sector, the same appetite for risk or the same economic conditions. Thirty-seven strong strategies can still turn into one crowded trade when the market gets ugly.
Thirty-Seven Winners Can Still Lose Together
Think about a baseball manager choosing nine hitters only because each one has a great batting average. Then the game starts and all nine struggle against the same kind of pitch. He did not build a great lineup. He collected nine impressive statistics with the same hole in them.
Trading strategies can behave the same way. Each one may look wonderful alone and still lose during the same ugly stretches as everybody else.
That is what the matrix was built to find. We compared every strategy with every other strategy and paid special attention to the weak periods. I wanted candidates that worked together smoothly, especially when the market was being a jerk.
Two strategies moving up together is not usually the problem. The problem is discovering that both of them fall apart during the same selloff, rate shock or burst of fear. That is when the protection you thought you owned disappears exactly when you need it.
The matrix let us look beneath the average relationship and focus on those bad stretches. A candidate earned more respect when its difficult periods arrived at different times from the rest of the group. That helped one strategy carry more of the load while another was having a rotten week.
The best strategy standing alone was not always the best teammate. A slightly less spectacular strategy could earn the slot if it helped smooth the entire group. I was building a lineup, not handing out trophies for the prettiest individual backtest.
That is a hard decision after spending months hunting for giant returns. The temptation is to rank the candidates from highest annual return to lowest and simply take the top 30. That would be easy, obvious and wrong. A well-synchronized portfolio can be stronger than a collection of individual superstars that all stumble over the same obstacle.
Now let us clear up the two numbers that matter here. The 37 strategies are the final roster. The meta strategy can dynamically select up to 30 of them at one time and divide the money evenly among the selected group. A member can also set the maximum to 10 or 20, but around 30 has consistently been the sweet spot for smoothness and winning months.
The 10-strategy and 20-strategy versions still produced the same broad kind of behavior. As the lineup expanded toward 30 well-matched strategies, the gains became smoother and the percentage of profitable months improved. Thirty gave more strategies a chance to take turns without spreading the capital across an endless pile of weak ideas.
Think of the 37 as the full team and 30 as the usual game-day lineup. The other seven remain available when a strategy is removed from active duty.
There is no magic in throwing 30 random strategies into an account. The value comes from choosing strategies that play well together.
What Happened During the Weak Periods
The matrix helped solve the selection problem. Then an old allocation problem came back to bite me.
The Runaway Winner That Broke the Portfolio
I first ran into this problem many years ago while building multi-strategy portfolios. The portfolio started with equal allocations and looked wonderful. Then one strategy went on a tear, compounded much faster than everything else and quietly became the elephant in the room.
The gains looked fantastic until that strategy pulled back. Then the whole portfolio dropped much harder than it should have because one winner had been allowed to take over.
I remember staring at the result and asking, “What the heck happened?” The individual strategies had not suddenly stopped working. The lineup had not changed. The weights had changed behind my back.
Suppose ten strategies begin with $10,000 each. One of them doubles while the others stay flat. That winner now controls $20,000 of a $110,000 portfolio. Let it double again while the others remain flat and it controls $40,000 of a $130,000 portfolio. It began with 10% of the money and quietly grew to more than 30%.
The account still lists ten strategies. In reality, one strategy is driving almost a third of the ride.
That old lesson mattered again when I looked at the individual strategies in this project. I was seeing annualized returns around 55%, 58%, 69%, 71%, 123% and 186%. Those strategies had different amounts of history, but the point was obvious. When one compounds at 186% and another compounds at 55%, equal starting allocations do not stay equal for long.
Put those kinds of strategies into one account and the weight drift becomes obvious. The strategy compounding at 186% grows its sleeve far faster than the one compounding at 55%. The better one strategy performs, the more capital it pulls toward itself for the next round.
Yesterday’s biggest winner keeps getting a larger pile of money for tomorrow’s trade. Before long, a portfolio that still appears to hold many strategies is really being driven by one of them.
The solution was monthly rebalancing.
Once a month, the portfolio resets the active strategies to equal allocations. The winner keeps its place, but it no longer gets to decide how much of the entire account it controls simply because it had a hot streak. Daily rebalancing would create too much churn. Waiting too long would allow the weight drift to take over again. Monthly hit the balance I wanted.
The practical mechanics are simple. No position can stay open beyond the monthly checkpoint. The meta strategy selects the active lineup, and the available capital is divided evenly among it again. Every selected strategy starts the new round from the same base.
That monthly reset also makes the portfolio easier to understand. If one strategy is having an extraordinary year, I can enjoy the gain without letting it become the accidental owner of the account.
Little hinges swing big doors. A brilliant collection of strategies can still be wrecked by one quiet allocation mistake.
Why We Rebalance Every Month
The Age-Old Question: When Do You Stop Trading a Strategy?
Monthly rebalancing solved the problem of one runaway winner taking over the portfolio. It did not solve another problem every systematic trader eventually faces.
What happens when a strategy simply stops working?
Markets change. A stock can go from loved to hated. Its business can change, its trading behavior can change and a pattern that repeated beautifully for years can begin coming apart.
This is where human judgment can become expensive. Some traders abandon a good strategy after three annoying losses. Others hang on forever because the old equity curve was gorgeous and they cannot accept that the market may have changed.
The age-old question has always been the same: When do I stop trading the strategy?
With Outlier, that answer is mathematically defined.
INTERACTIVE PROTECTION LAYER
Watch the switch remove a fading strategy.
Click through the three stages to see how a strategy moves from active duty to an automatic cutoff.
TRADING
The strategy is behaving as expected.
Performance remains inside its verified operating range, so Outlier keeps it active.
Every one of the 37 strategies contains an automated rule I call the Dead Man’s Switch. It watches the strategy’s performance against the behavior it was built to produce. The exact formula stays inside Portfolio Boss, but the decision is automatic.
When the strategy mathematically fails, there is no committee meeting and no waiting around until next week to see whether everybody feels better. The strategy immediately flips to a sell signal. At the next market session, APM closes the position and removes the strategy from the active lineup. The meta strategy can immediately select a replacement from the seven reserves.
That is another reason the numbers 37 and 30 matter. Around 30 active strategies gave us the sweet spot for smoothness and winning months, but Outlier includes all 37. If the Dead Man’s Switch removes one, the meta strategy has seven additional strategies available and can bring another one into the active group.
The failed strategy is not erased from the library forever. Its future behavior can still be measured, and it can prove itself again under the same mathematics. In the meantime, it does not get to keep risking money merely because it used to work.
You do not have to stare at the equity curve, argue with yourself or remember to run a weekly review. The rule is built into every strategy, and Autonomous Portfolio Management handles the change behind the scenes.
Now the portfolio had three important layers of discipline. The matrix chose strategies that worked well together. Monthly rebalancing kept one hot strategy from taking over. The Dead Man’s Switch removed a strategy when its own performance stopped meeting the mathematical standard.
With the lineup, the allocation control and the automatic replacement process in place, I could finally look at the result that mattered.
The Result I Was Looking For
The combined historical simulation ran from April 2014 through the August 2026 research cutoff, using a maximum of 30 dynamically selected strategies at a time. Before commissions and slippage, it produced a 53.6% annualized return, a 10.8% maximum drawdown and winning months approximately 93% of the time.
The Stability-Focused Result
That combination is what grabbed me. A giant return is exciting, but people crave consistency and stability in their lives, especially with their money. Seeing a strong return with winning months about 93% of the time was a big deal.
Annualized return tells me how fast the historical capital compounded. Maximum drawdown tells me how deep the worst peak-to-valley drop became. I want to see those numbers together because a 50% return is much less appealing if earning it requires watching half the account disappear along the way.
The 10.8% drawdown put the 53.6% return in a completely different light. This was not a giant return purchased with a 40% or 50% hole. The historical ride was far smoother than that.
The largest drawdown came during the 2020 COVID crash. The portfolio got hit, then rocketed right back up. In fact, 2020 became its greatest year, with a 97% return in the historical simulation.
That sequence matters to me. The system did not simply survive by crawling into cash and staying afraid. It got back into stocks as the opportunities returned and turned the year of its largest drawdown into its strongest calendar year.
The return-to-drawdown relationship was also exceptional. Divide 53.6 by 10.8 and you get a MAR ratio of approximately 5. In plain English, the annualized return was about five times the worst drawdown. That is one heck of a reward-to-pain relationship.
Then I looked at how long the painful periods lasted. The average recovery time was approximately four and one-third trading days, measured from a closing equity high to the next closing equity high. The portfolio would get knocked down, dust itself off and start making new highs again on a remarkably short average clock.
Drawdown depth and drawdown time are two different kinds of pain. A sharp decline can scare you. A smaller decline that refuses to recover can exhaust you. The 10.8% number described the deepest historical hole. The 4⅓-day average described how quickly the simulation usually climbed back to a new closing high.
That is the little-engine-that-could quality I love. The portfolio kept chugging. It could get knocked below a high and then, on average, find its way back in less than one trading week.
The monthly record stayed strong into the recent data too. April 2024 was the most recent losing test month. From the beginning of 2026 through the August research cutoff, the simulation gained approximately 30%.
The 93% figure may be my favorite part of the entire result. Most people can tolerate an occasional losing month. What wears them down is a strategy that makes one giant score and then asks for faith through a long string of red months. Consistent progress makes it much easier to keep following the rules.
Consistency, Month After Month
The average trade lasted about one week, so this was not a portfolio that bought 30 stocks in 2014 and went to sleep. Underneath that smooth curve, strategies were constantly entering, exiting and handing capital back and forth.
I had the smooth result I wanted. Naturally, I tried to squeeze out even more.
I Squeezed for More. I Did Not Like the Trade
I added Meta ML and pushed the annualized return from 53.6% into roughly the 63% area. The computer found more return, just as I had asked.
It also increased the drawdown.
Meta ML was a separate layer from the matrix. The matrix helped choose strategies that worked well together. Meta ML tried to become more aggressive about which opportunities received attention. It succeeded at the assignment, but the portfolio started demanding a higher emotional price.
Meta ML: More Return, A Rougher Ride
On a spreadsheet, the bigger return is tempting. In real life, drawdown is not a tidy little cell. It is the money you watch disappear while you wonder whether the strategy has stopped working.
That is the problem with optimizing only for CAGR. The computer keeps reaching for more growth because that is what you told it to do. It does not lose sleep, argue with a spouse or panic after opening the brokerage statement. The fitness function has no blood pressure.
Take a $100,000 account. A 10% drawdown takes it to $90,000. A 15% drawdown takes it to $85,000. Getting back to even requires an 11.1% gain in the first case and about 17.6% in the second. Those extra five percentage points of pain create a much bigger recovery job.
Two people can look at that tradeoff and react very differently. One sees the extra return and wants it. The other sees the deeper drop and starts imagining college tuition, retirement money or the look they are going to get across the dinner table. A strategy that becomes emotionally impossible to follow is a bad fit no matter how attractive the spreadsheet looks.
That is also when you start buying Pepto-Bismol by the gallon at Costco.
I am in my 50s now. I value a smooth ride and fewer headaches more than I used to. The extra juice was not worth the squeeze for me, so I chose the 53.6% version with the smaller drawdown and greater consistency.
Meta ML still answered a valuable question. More return was available if I accepted a rougher ride. I simply preferred the version I could imagine following calmly through a bad month without grabbing the steering wheel at exactly the wrong time.
That decision brought me back to a portfolio lesson I first learned roughly 20 years ago, when the whole idea had a much simpler name.
Project Lego Comes Full Circle
I built my first trading strategy in 1997 and programmed it by hand in Perl. Roughly 20 years ago, I became a beta tester for Project Lego, manual strategy-design software connected to Curtis Faith, one of the original Turtle Traders.
Nothing was automatic. You wrote the rules, chose the markets, ran the tests and inspected the results by hand. Compared with the machinery we have today, it was the trading equivalent of building a house with a hammer and a box of nails.
The name was perfect. A strategy was one Lego brick. The real power came from snapping several different bricks together and building something stronger than any one piece.
That was where I learned the lesson I have repeated ever since: when one strategy zigs, another can zag.
Boy, oh boy, was he right.
The best strategy standing alone is not always the best choice for the portfolio. What matters is building a well-synchronized portfolio in which the strategies carry the load at different times.
One strategy may love a fast upward market. Another may earn its keep when prices snap back after a selloff. A third may sit quietly until a completely different pattern appears. The goal is not to force every brick to do the same job. It is to assemble them so the structure keeps standing when conditions change.
Back then, we wrote the rules by hand. We did not have Strategy Mill, 1.2 billion backtests, a giant comparison matrix or software that could rebalance and coordinate the whole group. We understood the principle long before we had the machinery to do it properly.
Selecting the pieces was difficult enough. Keeping them balanced was another job. Then every signal had to be translated into an order, every order had to be checked and every position had to be tracked. The concept was elegant. The daily work was a pain in the butt.
That is why this project feels like coming full circle. The 37 strategies are the Lego bricks. The matrix helps decide which pieces belong together. Monthly rebalancing keeps one piece from taking over the structure.
More than two decades of computing progress finally allowed us to turn that old lesson into something practical. We could search thousands of symbols, test an industrial number of rules, throw away almost everything, compare the survivors as a group and keep the weights from wandering off on their own.
And even after solving all of that, we had only solved the research problem. The strategies still had to meet the real market, where a signal and a fill are two very different things.
Project Lego Comes Full Circle
When a Backtest Signal Meets a Real Order
About 20 years ago, I bought a day-trading strategy for the E-mini S&P 500. In the simulation, it looked incredible. It traded so frequently that it was almost high-frequency trading, and for a while I thought I had found something that was going to make me millions of dollars.
The curve was so smooth that it barely looked real. That should have been my first clue.
Then I traded it with real money.
After commissions and slippage, the thing went sideways. I had paid good money for a total pile of crap.
The hidden problem was the limit-order assumption. The simulation gave me a fill whenever the market merely touched my limit price. In the real order book, other orders were already waiting ahead of mine. The price could touch my limit and bounce away while I received nothing.
Imagine I place a buy limit at 5000.00 and the E-mini trades there for one instant. The old simulator marked me filled. In reality, thousands of contracts may have been ahead of me in the queue. If only a few contracts traded at that price, my order never got its turn.
The fake fills were usually the best-looking fills too. The simulator happily bought the low tick and sold the high tick, which is a wonderful way to manufacture a fantasy fortune.
That bloody lesson is now built into Portfolio Boss. Our simulator has a checkbox requiring the market to exceed the limit price before the trade counts as filled. If a strategy wants to buy at $20, a daily low of exactly $20 is not enough. The market has to trade below it. For a sell limit, it has to trade above it.
That one checkbox makes the backtest less flattering and much more useful. I would rather reject a strategy because it missed a few imaginary fills than discover the truth after wiring real money to the broker.
You can see the same garbage when you accidentally simulate penny stocks. The computer thinks it bought at the exact low and sold at the exact high, and suddenly you have the smoothest equity curve in the history of capitalism. It is complete nonsense caused by imaginary fills.
That checkbox came from hard-earned blood on the battlefield.
Once the fill logic is realistic, order choice becomes much easier to explain. A limit order protects the price but may miss the trade. A more aggressive order improves the chance of getting filled but may pay the spread. A deep resting bid can sometimes catch the wave of selling from other traders getting stopped out, which lets us provide liquidity instead of chasing the market.
I call some of those deep bids fishing. The strategy puts the order well below the previous close and waits. If a fast decline knocks other traders out, their selling can come to us. Those are often the days when volume expands and hidden liquidity suddenly appears, which can make the average daily volume look far less useful than the actual moment of entry.
For larger orders, Interactive Brokers gives us several useful tools. Accumulate/Distribute can break one large order into smaller pieces. Relative and Passive Relative orders can follow the bid or offer without forcing us to keep replacing a static price. SMART routing can help choose among available venues, fill opportunities and fees.
Accumulate/Distribute is useful when announcing the full order would be like walking into a poker game and showing everybody your cards. The pieces can be varied over time so the market does not see one giant block sitting in plain view.
It becomes even more useful as an account grows because it can help scale into and out of a position without throwing the entire order at the market at once.
It also solves a very practical problem in retirement accounts, which the vast majority of our members have. Many retirement accounts operate as cash accounts, so the selling has to happen before the buying can use the newly available cash. With an ordinary order, a buy that arrives before enough cash is available can simply be canceled. That is it. The order does not sit around politely waiting for the sells to finish.
Accumulate/Distribute keeps working the order and can continue trying as the selling releases cash. That makes it an ideal tool for coordinating the sells first and the buys afterward in an IRA, a spouse’s IRA or another cash account.
Relative orders solve a different headache. Instead of leaving one price sitting there while the market moves away, the order can follow the bid or offer according to the settings. Passive Relative can stay on the more patient side when that is what I want. SMART routing then looks across the available destinations rather than forcing every order through one door.
Each tool solves a different problem. Slicing reduces the footprint but takes more time. Pegging follows the quote but still requires patience. A resting limit can save money on price and then leave you standing at the station while the trade departs without you. That is trading.
Entries are usually easier than exits. I may have time to fish with a limit order below the market when entering. If a company gaps on earnings or several strategies need out at once, the market is not obligated to give me the same relaxed exit.
That is why I do not want a portfolio built from stocks where our own order is the market. The cleverest entry technique in the world cannot create buyers during a panicked exit.
Now multiply those decisions across a portfolio whose average trade lasts about one week. Signals arrive on different days. Some orders fill completely, some fill partially and some sit there doing nothing. Capital gets released by one strategy while another is asking for it.
The brokerage account becomes a moving puzzle. A signal says what we wanted. The fill tells us what actually happened. The next decision has to begin with the fill, not with the wish.
At that point, the problem is no longer choosing an order type. The problem is coordinating the entire portfolio.
The Last Bottleneck Was Not Clicking Buy
One strategy is manageable. A signal arrives, you place the order, check the fill and update the position.
Now do that across roughly 30 strategies. One is entering while another is exiting. One account fills completely while another gets a partial fill. A retirement account has different cash available from the taxable account. A strategy wants money that another trade has not released yet.
The number of decisions grows much faster than the number of strategies. Thirty strategies do not create only 30 order tickets. They create entries, exits, partial fills, canceled orders, rejected orders, allocation changes and account-by-account differences, all arriving on their own schedules.
The dangerous mistake is rarely forgetting what the Buy button does. It is acting on the portfolio you think you have instead of the portfolio you actually have.
For the past few years, we used Interactive Brokers’ BasketTrader to import groups of orders. That removed a great deal of typing and clicking, which was helpful. But a basket remembers the orders you sent. It does not remember the entire portfolio, understand why one order failed or decide what should happen next after the real positions drift away from the plan.
Suppose the basket sends 20 orders and 18 fill. The spreadsheet still shows the beautiful portfolio you intended to own. The broker shows the one you actually own. If tomorrow’s sizing decision uses the spreadsheet instead of the brokerage account, the error begins to compound.
A partial fill changes the available capital. A rejection leaves one account different from another. A stale order can create a duplicate. A crash or lost connection can interrupt the whole sequence at the worst possible moment.
Multiple accounts make the puzzle harder. A main account, an IRA and a spouse’s IRA may follow the same strategies while holding different cash balances and receiving different fills. The correct next action can be different in each account even though the original signal was identical.
You can manage all of that by hand. I did for years. But now the smooth, low-headache portfolio has turned into a full-time job of checking screens, reconciling positions and wondering what you missed while you went to lunch.
The final bottleneck was not sending orders. It was keeping three things connected at all times: what the portfolio should own, what the brokerage accounts actually own and what the rules say should happen next.
That required something much bigger than ordinary auto trading.
Autonomous Portfolio Management
The answer was Autonomous Portfolio Management.
Ordinary auto trading takes a signal and sends an order. APM runs the portfolio around that order. It coordinates the selected strategies, equal allocation, monthly rebalancing, multiple accounts, actual fills, partial fills, rejected orders and the next action the rules allow.
That difference is enormous. Ordinary auto trading says, “The strategy generated a buy signal, so I sent a buy order.” APM keeps going. Did the order fill? How much filled? Which account owns it? How much capital is still available? Did another strategy exit? Is the new action allowed under the portfolio rules?
In plain English, APM keeps the portfolio you intended to trade from drifting away from the portfolio sitting at Interactive Brokers.
That was a big freaking deal.
It meant the 37 strategies could stop behaving like separate islands. The portfolio could select the active group, divide the capital evenly, coordinate orders across the member’s Interactive Brokers accounts, verify what happened at the broker and use the real account state for the next decision.
I sometimes joke that I cannot let Elon have all the fun with autonomous cars. The funny part is that autonomous trading has the same brutal final-mile problem. The normal path is easy. A signal appears, an order goes out and the order fills. The last 1% is where a broker rejects something, one account fills differently from another, Trader Workstation hangs or the system has to restart without forgetting what already happened.
The demo path can look finished in a week. The exception path eats years. A system has to recover from the oddball events without sending the order twice, forgetting an open position or treating yesterday’s account state as though nothing changed.
Autonomous Portfolio Management
The portfolio-management project took more than two years. We went through several staffing attempts that could not get it across the finish line. Then Ruud took on much of the final engineering, which became a nearly two-year effort of its own.
Ruud has been our lead engineer since 2014. He began as one of the original Portfolio Boss customers, made the program dramatically faster and eventually became the person I trusted with the hardest part of this build. All these years later, the software has grown into one of the most advanced trading platforms available to a retail trader.
The last 1% was the killer. Every time the normal workflow looked finished, another strange broker response, partial fill, restart problem or account mismatch crawled out from under a rock.
That last 1% was a 10 out of 10 on my pain-in-the-butt meter. There were moments when the system looked complete, then one weird sequence would expose a hole that forced us back into the machinery. Fix it, test it, find the next one, repeat.
That is the unglamorous work behind real automation. The exciting part is what it finally made possible. Instead of operating 30 strategies as 30 separate little robots, we could coordinate them as one well-synchronized portfolio.
The member remains in control and can check, pause or override the operation. The computer handles the repetitive coordination that no human wants to babysit all day.
That is the balance I wanted. I do not want to sit at a desk twiddling my thumbs while 30 strategies trade on different schedules. I also do not want a black box making up its own trading philosophy. The rules are ours, the account is yours and the software does the exhausting bookkeeping in between.
By this point, the pieces had finally come together: 37 strategies, a mathematical way to choose which ones worked best together, monthly rebalancing, realistic execution and an operating system capable of coordinating the portfolio.
There was only one program big enough to become the home for all of it.
The New Outlier
If your head is spinning a little after everything we just covered, I understand. This report has taken you through more than 3,000 symbols, roughly 1.2 billion backtests, four completely different sources of edge, three layers of unseen testing, a 65-strategy final round, a mathematical comparison grid, monthly rebalancing, realistic order handling and an automatic answer to the question, “When do I stop trading a strategy?”
That is a lot of machinery, but all of it led to one simple conclusion.
Finding 37 unusual strategies was not the finish line. Those strategies had to be turned into a well-synchronized portfolio, and that portfolio had to be managed in the real world when orders, accounts, markets and technology refused to behave politely.
That is what Outlier has become.
Outlier is Portfolio Boss’s flagship systematic trading program. If you join the program, you will receive all 37 fully built strategies, a meta strategy that can dynamically select and equally allocate up to 30 at a time, the Dead Man’s Switch inside every strategy, Meta ML and Autonomous Portfolio Management running through your own Interactive Brokers accounts while you remain in control.
The name still fits perfectly. We searched an enormous field, rejected almost everything and kept the rare outliers that earned their place.
The Number That Matters Almost as Much as 53.6%
The stability-focused historical simulation ran from April 2014 through the August 2026 research cutoff. Before commissions and slippage, it produced a 53.6% annualized return with a 10.8% maximum drawdown.
And approximately 93% winning months.
That last number deserves a spotlight because hyper-consistency has been one of my biggest goals for the past several years. A 53.6% annualized return is already world-class. Producing that kind of historical return while finishing approximately 93% of the months in positive territory is what made me sit back in my chair and stare at the screen.
People crave consistency in their lives, and they especially crave it with their money. A strategy that makes one giant score and then spends month after month taking it back can look wonderful on a long-term chart while being miserable to trade. I wanted the opposite. I wanted progress that kept showing up.
Every major portfolio decision pointed toward that goal. The matrix looked for strategies that could carry the load at different times. The 30-strategy sweet spot improved the percentage of winning months. Monthly rebalancing kept yesterday’s hottest strategy from hijacking tomorrow’s account. The Dead Man’s Switch removed a strategy when its performance stopped meeting the mathematical standard.
That focus affected which strategies survived. I threw out several strategies that could have contributed greatly to the annual return because they did not contribute enough to the smooth ride I was trying to build. The mission was not to make the biggest number I could possibly print on this page. It was to find the best combination of substantial gains, small drawdowns and consistency I could imagine following with my own money.
Then I turned Meta ML loose on the same problem and pushed the annualized return into roughly the 63% area, nearly 10 percentage points higher. The drawdown grew too.
Some people may look at that trade and happily accept a rougher ride for more return. Meta ML is included, so that choice is available. It was not the choice I made for the main configuration. I am getting older, and 53.6% a year with a 10.8% maximum drawdown and approximately 93% winning months is plenty exciting for me.
That is the result around which I wanted the final Outlier system built.
Why I Trust These Results
The 53.6%, 10.8% and 93% figures did not come from one lucky strategy or one pretty chart. They were the final result of a research process that kept looking for reasons to say no.
More than 3,000 symbols and roughly 1.2 billion backtests: The search was 7.5 times larger than the universe we had attacked before.
Three layers of validation: The computer built the rules in one period, took a first unseen exam and then faced a second sealed period. For example, the Palantir strategy that showed annual returns above 100% in the first two periods went straight down when we opened the final year. A strategy that fails there is killed immediately and never reaches the final group.
A 65-to-37 final cut: Liquidity, capacity, duplicate symbols, same-stock buy-and-hold comparisons and portfolio fit removed another 28 serious candidates after the main search was finished.
A brutal real-world test in 2020: The largest drawdown occurred during the COVID crash, yet the portfolio rocketed back and finished 2020 with a 97% historical return.
Fast historical recovery: The average trip from a closing equity high back to a new closing high was approximately four and one-third trading days.
Recent strength: April 2024 was the most recent losing test month, and the simulation gained approximately 30% from the beginning of 2026 through the August research cutoff.
That’s the kind of proof I wanted before putting the Portfolio Boss flagship name behind this project.
That Concludes the Research Report. Here’s Your Invitation.
You’ve seen what we searched, what survived and how we turned the survivors into a portfolio. Thank you for taking the time to follow the evidence with me.
Now I invite you to take a look at a special offer for readers who’d like to put this research to work through Outlier, Portfolio Boss’s flagship program.
And there’s one more discovery to tell you about. After this report was finished, I ran another 210 million backtests and uncovered a fifth edge. I didn’t have time to cover that research in these pages, but the strategies from that additional research are included in the offer below.
Here Is What You Receive Today
When you join Outlier, the research does not arrive as a giant homework assignment. The strategies, portfolio framework and automation appear inside Portfolio Boss so you can put the completed system to work.
1. All 37 Final Strategies, Plus the New Fifth Edge
You receive all 37 strategies in Portfolio Boss’s native format. They appear automatically in your installation, ready to use with the portfolio framework we built around them.
You also receive the strategies from those additional 210 million backtests, including the newly discovered fifth edge. That research came after the report was completed, so it’s additional to the original 37-strategy lineup and the historical results you’ve just read.
The included meta strategy can dynamically select up to 30 at one time and divide the available capital evenly among the selected group. You can set the maximum to 10 or 20 if that better fits how you want to trade, but around 30 has consistently been the sweet spot for smoothness and winning months.
You can also run different groups in different supported accounts. You might trade 30 strategies in your main account, 20 in your retirement account and the top 15 in your wife’s retirement account. It is up to you.
Every one of those accounts benefits from the same four-edge search, three layers of validation, liquidity and capacity review, and the hard-earned lessons from decades of trading real money.
Think of the 37 as the complete team and 30 as the usual game-day lineup. The seven additional strategies are ready when the Dead Man’s Switch removes one from active duty.
That gives the portfolio room to adapt without asking you to begin another two-month research project every time a strategy falls out of favor.
2. Autonomous Portfolio Management and Meta ML
Autonomous Portfolio Management handles real portfolios, not just real orders.
Ordinary auto trading sees a signal and sends an order. APM keeps going. It tracks which strategies are active, how capital is divided, what each account actually owns, whether an order filled, whether it filled only partway, whether it was rejected and what the rules say should happen next.
It coordinates entries, exits, monthly rebalancing, the Dead Man’s Switch and the selected strategy lineup across your supported Interactive Brokers accounts. It can handle advanced order types, monitor the operation, generate alerts and reporting, and recover from supported Trader Workstation or Portfolio Boss hangs and crashes.
Outlier supports coordination across as many as five Interactive Brokers accounts and installation on as many as three computers. That matters if you have a main account, an IRA, a spouse’s IRA or other supported accounts that need to follow the same portfolio while maintaining their own cash, positions and fills.
You still own the accounts, choose the settings and retain the ability to review, pause or override the system. The computer handles the exhausting coordination between the decisions.
Think about what that changes in your day. A round of golf, lunch with your wife or a few days away no longer has to be planned around manually entering every trade. With the system set up and running, APM handles the routine order work across your accounts.
You still check in and handle anything that needs your attention. But the point of building all this machinery is to give you more room to enjoy the life you’ve worked so hard to build.
Meta ML is included too. If you prefer the more aggressive historical return profile and are comfortable with the higher drawdown, you have the tool that produced it. If you prefer the stability-focused configuration I chose, you have that as well.
Autonomous Portfolio Management in Action
3. The Dead Man’s Switch
Every one of the 37 strategies includes the automated performance rule you just read about.
When a strategy mathematically fails, the Dead Man’s Switch immediately changes it to a sell signal. At the next market session, APM closes the position and removes the strategy from the active lineup. The meta strategy can immediately select another strategy from the seven available alternatives.
You do not have to guess whether three losses are too many, wait for a monthly meeting or keep trading a dying strategy because its old backtest still looks pretty. The answer is already defined inside the strategy, and APM handles the change behind the scenes.
THE OUTLIER OPERATING MODEL
37Fully built strategies
→
UP TO 30Dynamically selected and equally allocated
→
7 READYAlternatives available when the Dead Man’s Switch removes one
4. Guided Cloud Setup With Alexander — $499 Free
Alexander guides you through setting up Portfolio Boss and APM in the cloud. We help configure the cloud computer, connect the supported Interactive Brokers workflow and make sure you understand how to check what the system is doing.
Normally, that guided setup costs $499. Join by this month’s deadline and we’ll waive the entire setup fee.
Cloud hosting is optional. If you choose it, our preferred vendor charges $60 per month, paid directly to the vendor, to host the cloud computer that runs your automation. That hosting charge is separate from your Outlier subscription.
I strongly recommend the cloud setup instead of depending on one laptop sitting at home. I learned that lesson years ago while I was away playing golf. My laptop-based setup failed, I couldn’t get to it quickly and I wound up down approximately $3,000. That’s not how I want to spend an afternoon on the golf course.
With the cloud setup, you can check the system from a phone, laptop or another computer. You can see what’s happening without having to get back to the machine sitting on your desk.
SPECIAL OFFER FOR REPORT READERS
Guided Cloud Setup: $499FREE
Join by the setup deadline confirmed by Adam and we’ll waive Alexander’s $499 guided setup fee.
00Days
00Hours
00Minutes
00Seconds
Optional cloud hosting is $60/month, paid separately to our preferred vendor.
5. Every Year, We Rebuild All the Strategies From Scratch
This is a big part of what your Outlier subscription includes. Every year, we’ll rebuild all the Outlier strategies from scratch, using our latest technology and research breakthroughs to keep the program current.
Think of it like maintaining a Ferrari. You don’t just park it in the garage and assume it’ll stay finely tuned forever. You change the oil, service the transmission and have a professional get under the hood. A serious machine deserves serious upkeep.
For Outlier, that means going back into the research and rebuilding the strategies with the best tools and methods we have at the time. As our technology advances, those advances become part of the next rebuild.
Strategy Mill and our supercomputer make that enormous research job far more practical. We’ve built the machinery to do the heavy lifting, and my team and I can put it back to work for Outlier every year.
Your subscription includes that continuing research and the annual rebuild, so the program can keep moving forward as our technology does.
Your Bonus: Live Event Recordings
I’m also including the recordings from our September 2025 live event. This was a $25,000-per-seat event, and you’ll get the recordings as part of your Outlier subscription.
The September 2025 Event Recordings
These sessions take you deeper into the methods behind the research.
At that event, all was revealed. I walked through our proprietary matrix formula, the strategy-development process, portfolio construction, execution, supervision and a great deal more. The recordings give you the full classroom version of the machinery behind Portfolio Boss and Outlier.
Inside the RoomPortfolio Boss Live Event · September 2025
See the room, the teaching and the people behind the September 2025 event recordings included with Outlier.
Four Years of Real Money Behind These Methods
The 37-strategy Outlier lineup is new, but Portfolio Boss members have been trading strategies built from these four edges with real money for four years.
Below are verified brokerage statements from Portfolio Boss members with real money on the line using strategies built from the four edges you just read about.
ACTUAL BROKERAGE STATEMENTSPortfolio Boss members using strategies found through the Strategy Mill research workflow. Individual results are not typical.
The new portfolio adds the biggest search we have ever completed, the most selective final roster we have ever built, the strongest portfolio-level comparison we have used and an operating system that can finally coordinate the whole thing.
I have invested millions of dollars in Portfolio Boss research and engineering. Between my work and my team’s work, thousands upon thousands of hours have gone into solving the problems you just read about. Some of those problems sounded simple until we tried to make them work when a broker rejected an order at exactly the wrong moment.
Most people who buy Outlier have purchased something from me before. They have watched us deliver, improve the software and keep working long after the easy part was finished. That history matters to me, and I want the next step to fit the amount of capital they’re ready to put to work.
“Having a mechanical system makes life a whole lot easier.”
Mark AwadTrustpilot reviewer
★★★★★
“This is a simple process that allows me to get on with my day.”
Joanne BuckoTrustpilot reviewer
★★★★★
“His structured, systematic, data driven system is proven and without a doubt the answer for trading the markets.”
Russ LTrustpilot reviewer
★★★★★
“My Roth and IRA accounts have grown exponentially over the years thanks to PB and Dan’s training.”
Nigel CurtisTrustpilot reviewer
★★★★★
“The PB team is constantly testing and monitoring to ensure that you have the greatest opportunity to profit without spending hours and hours every day researching the markets.”
JohnTrustpilot reviewer
Individual experiences vary. Reviews describe each member’s own experience with Portfolio Boss.
Why I Am Celebrating This Release
Autonomous Portfolio Management took more than two years to finish.
We had false starts. We had staffing attempts that did not work. We had beta testing expose things that looked fine in a demo and absolutely were not ready for real portfolios. Every time we thought the last major problem was solved, the final 1% found another way to bite us.
On my personal pain-in-the-butt meter, this project was a perfect 10 out of 10.
What kept me so stubborn about finishing it? Honestly, I dislike placing trades. I love the research, the discoveries and seeing a well-built system come together. Sitting there entering orders is about as much fun as it sounds.
I wanted to be able to go play golf, take a trip or enjoy an afternoon without having to arrange everything around the next batch of trades. And I wanted that for our members, especially the ones who’ve spent decades working toward a retirement they could finally enjoy.
That picture stayed with me through the difficult parts of this project. Every time another problem sent us back into the machinery, I thought about what getting it right would make possible.
Now it is finally ready. We can automate multiple portfolios, coordinate advanced Interactive Brokers orders, reconcile actual fills, handle the exceptions and keep the portfolio connected from the strategy signal all the way through the brokerage account.
And now we can make the way you join a whole lot simpler. Instead of paying a $42,500 fee up front, you can get started with one monthly Outlier price, starting at $499.
Your capacity tier is based on how much money you’re autonomously trading through APM. Someone automating $100,000 uses a different amount of trading capacity from someone automating $1 million. Your Outlier level reflects the amount you want the system to trade.
Adam will help you choose the level that fits your accounts and the capital you plan to automate. And when you join by this month’s deadline, we’ll include Alexander’s guided cloud setup at no charge. Optional cloud hosting is $60 per month, paid directly to our preferred vendor. I recommend it, but it isn’t required.
YOUR OUTLIER SUBSCRIPTION INCLUDES
Everything the research becomes in your hands.
37 + MoreOriginal strategies plus the additional fifth-edge research
Up to 30Dynamically selected
7Available alternatives
AutomaticDead Man’s Switch
IncludedMeta ML
IncludedAutonomous Portfolio Management
Up to 5Supported IBKR accounts
Every YearAll Outlier strategies rebuilt from scratch with our latest technology and research
IncludedRecordings from the $25,000-per-seat September 2025 event
$499 FreeGuided cloud setup with Alexander when you join by the deadline
From $499/moCapacity pricing based on capital traded through APM
Your Outlier Membership Terms
Monthly subscription: Starting at $499 USD per month.
Capacity pricing: Your tier is based on the amount of capital you autonomously trade through APM. Adam will help you select the right level.
Included research: All 37 original strategies, plus strategies from the additional 210 million backtests and the newly discovered fifth edge.
Annual strategy rebuild: Every year, we rebuild all Outlier strategies from scratch with our latest technology and research breakthroughs. Included in your subscription.
Included tools: The meta strategy, Autonomous Portfolio Management, Meta ML and the Dead Man’s Switch inside all 37 original strategies.
Original portfolio structure: Up to 30 of the original 37 strategies may be dynamically selected and equally allocated, with seven alternatives available.
Broker and operating allowance: Interactive Brokers, up to five supported accounts and installation on as many as three computers.
Recommended trading capital: Approximately $100,000 or more across the accounts you plan to use.
Cloud hosting (optional): Recommended, but not required. $60 per month with our preferred vendor, paid directly to the vendor and separate from your Outlier subscription.
Guided cloud setup:$499Free with Alexander when you join by the deadline.
Bonus education: Recordings from our $25,000-per-seat September 2025 live event are included.
Support: Monday through Friday during business hours.
Sale policy: The sale is final once the proprietary strategies and trade-secret material are delivered.
Setup waiver deadline:The setup deadline confirmed by Adam.
WHAT HAPPENS NEXT
Find the Outlier Level That Fits You.
1
Call or text AdamStart the conversation and tell him you are calling about Outlier.
2
Discuss your capacity tierTalk through how much capital you want APM to trade and which Outlier level fits.
3
Confirm your plan and setupAdam confirms your monthly price, answers your questions and explains guided cloud setup.
A Quick Fit Check
I recommend approximately $100,000 or more across the accounts you plan to use. You’ll need Interactive Brokers and the ability to follow a rules-based process even when the market has an ugly week.
You do not need to be a programmer, learn the matrix formula or sit in front of a screen all day. You do need to complete the setup, check in periodically and remain in control of your accounts.
Adam will ask a few basic questions about your accounts, the capital you want to automate and what you’re trying to accomplish. That helps us recommend the right capacity tier and make sure the fit works both ways.
Talk With Adam About Your Outlier Level
The next step is to call or text Adam at 516-220-8221.
He’ll help you decide which level of Outlier fits the amount you want to trade autonomously through APM, explain the monthly price for that capacity tier and answer your questions.
Monthly pricing starts at $499. Join by the setup deadline confirmed by Adam and Alexander’s $499 guided cloud setup fee is waived.
Adam has strict instructions about follow-up. You may hear from us twice, and that is it. We are not going to chase you for three weeks because you asked a question. His job is to help you make a clear decision and make sure we are a fit for each other.
Call or text Adam at 516-220-8221 to discuss your capacity tier and guided cloud setup.
SPECIAL OFFER FOR REPORT READERS
Guided Cloud Setup: $499FREE
Join by the setup deadline confirmed by Adam and we’ll waive Alexander’s $499 guided setup fee.
00Days
00Hours
00Minutes
00Seconds
Optional cloud hosting is $60/month, paid separately to our preferred vendor.
You’ve Earned the Right to Live on Your Own Clock.
I began this mission looking for the strongest strategies I could find across more than 3,000 symbols. Roughly 1.2 billion backtests and years of engineering brought us to the system you’ve just seen.
The stability-focused historical simulation produced a 53.6% annualized return, a 10.8% maximum drawdown and approximately 93% winning months before commissions and slippage. You’ve seen the research behind those numbers and the work that went into turning the strategies into an automated portfolio.
Now picture what you’d like that portfolio to make room for.
It’s an ordinary Tuesday morning. You’re having coffee with your wife, talking about where you’d like to go for a few days. Breakfast runs a little longer because neither of you is in a hurry. Your plans for the afternoon are yours to make.
Maybe there’s a tee time with friends. Maybe you’re picking up the grandkids, taking the boat out or finally making that trip you’ve been talking about for years. The pleasure is being able to give those moments your full attention.
Meanwhile, your configured Outlier system is handling the routine trading work: following the rules, coordinating orders and keeping track of what your accounts actually own. You check in, stay in control and deal with anything that needs your attention. You can plan your day with far less of it devoted to manually placing trades.
That’s what I mean by living off the market’s clock.
If you’re approaching retirement, think about the days you’ve been looking forward to all these years. If you’re already retired, think about how you’d most like to spend next week. Having more say over your time is a big part of what makes those years worth working for.
I’m serious about this because I want the same thing. I’ve been building trading strategies since 1997, and I still love finding something in the evidence that everyone else missed. But I dislike placing trades, and I have plenty of things I’d rather do than spend my day entering orders.
That’s why I stayed with this project through every miserable engineering problem. The finished automation has been nothing short of spectacular to me because of the work it can take off our hands. I want you to have the time to actually enjoy the life you’ve been working toward.
With Outlier, you get the completed research, the automation and a team that rebuilds the strategies every year as our technology advances. We keep doing the research and development that brought you here.
Your next step is a conversation with Adam. Tell him about the accounts you want to automate and what you’d like to spend less time doing. He’ll help you decide which Outlier capacity level fits, with subscriptions starting at $499 per month.
Join by the setup deadline confirmed by Adam and we’ll also waive Alexander’s $499 guided cloud setup fee. Cloud hosting is optional, and Adam can walk you through the setup choices.
Call or text Adam at 516-220-8221 and take the first step toward putting more of your day back on your own clock.
Please note:
This action will also remove this member from your connections and send a report to the site admin.
Please allow a few minutes for this process to complete.

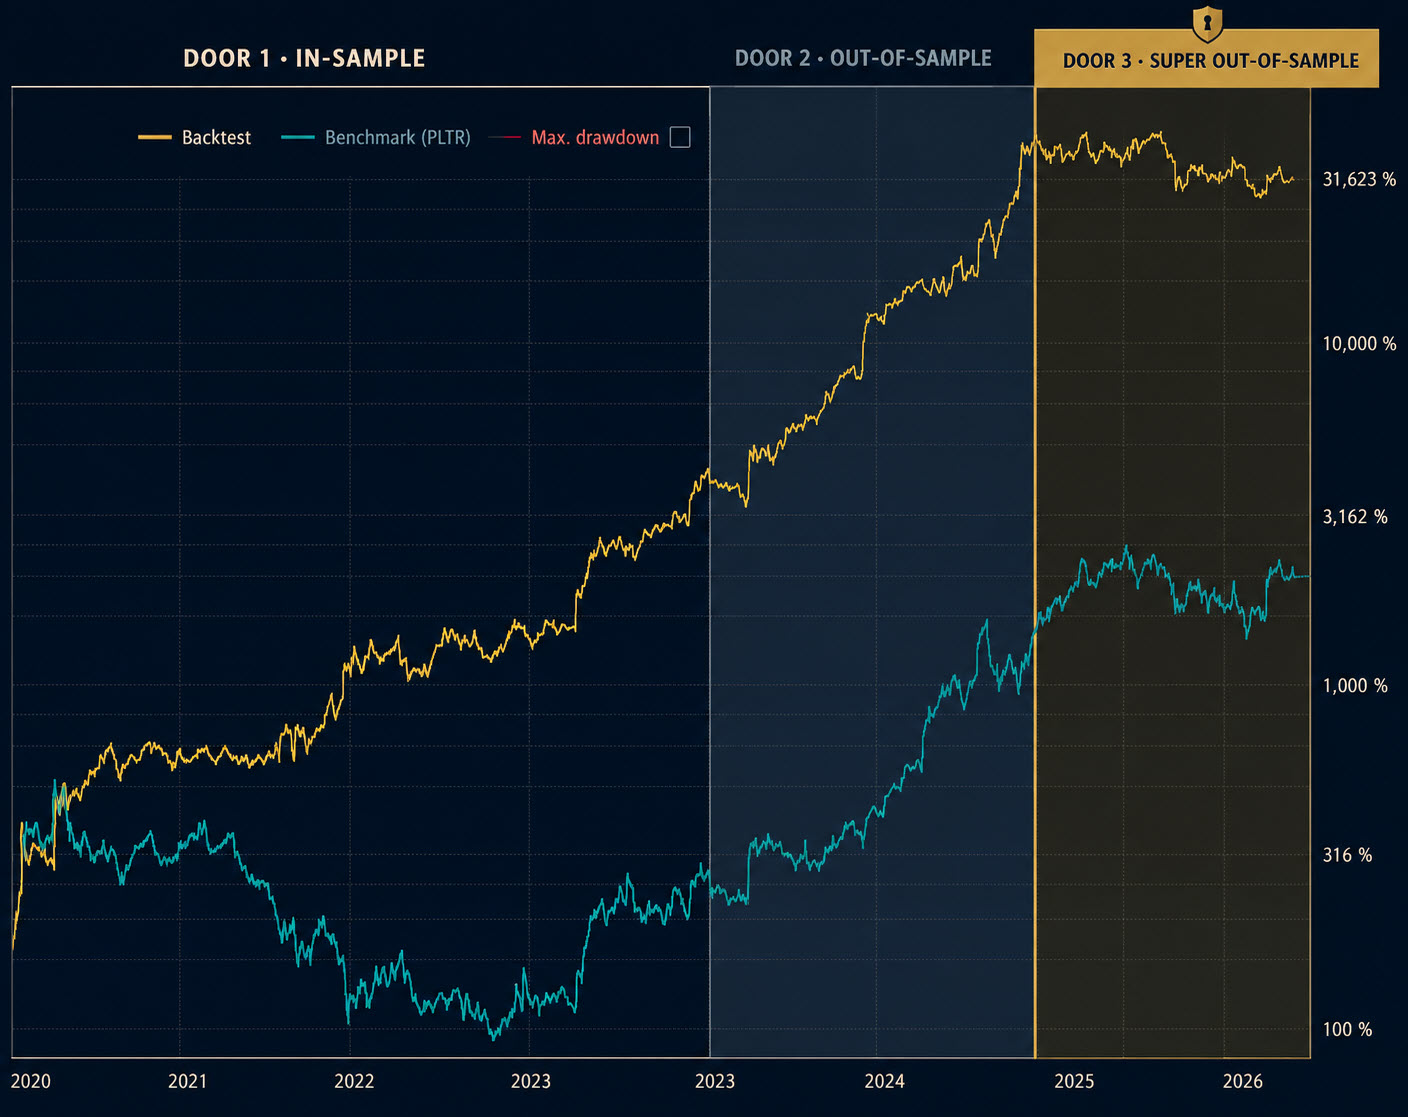
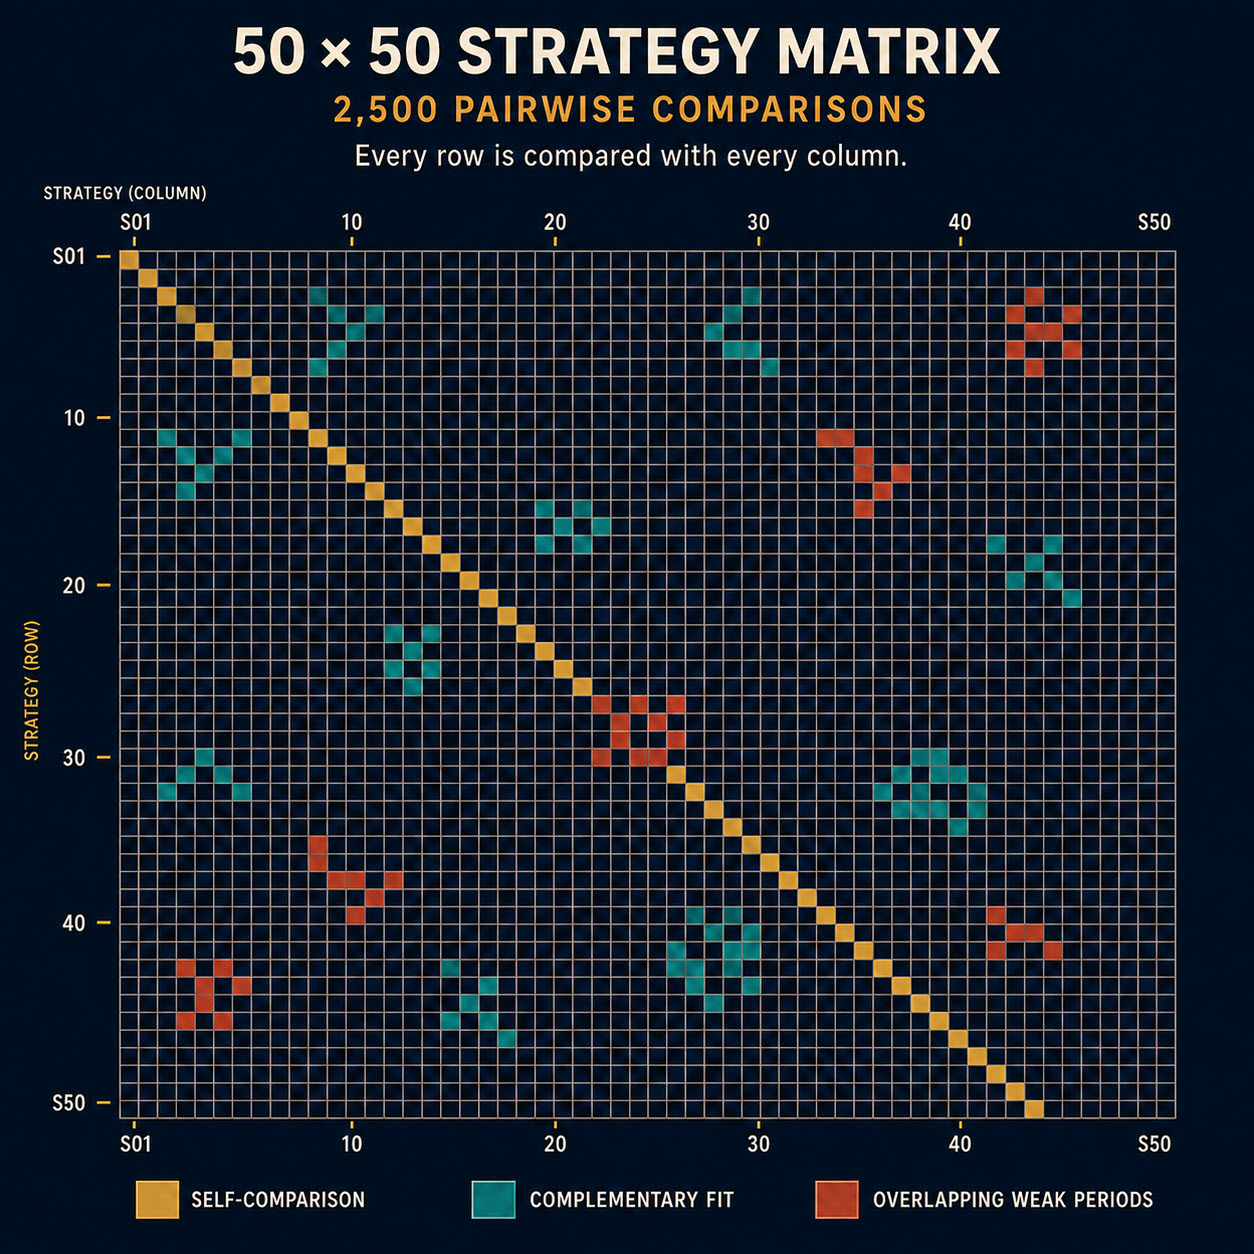
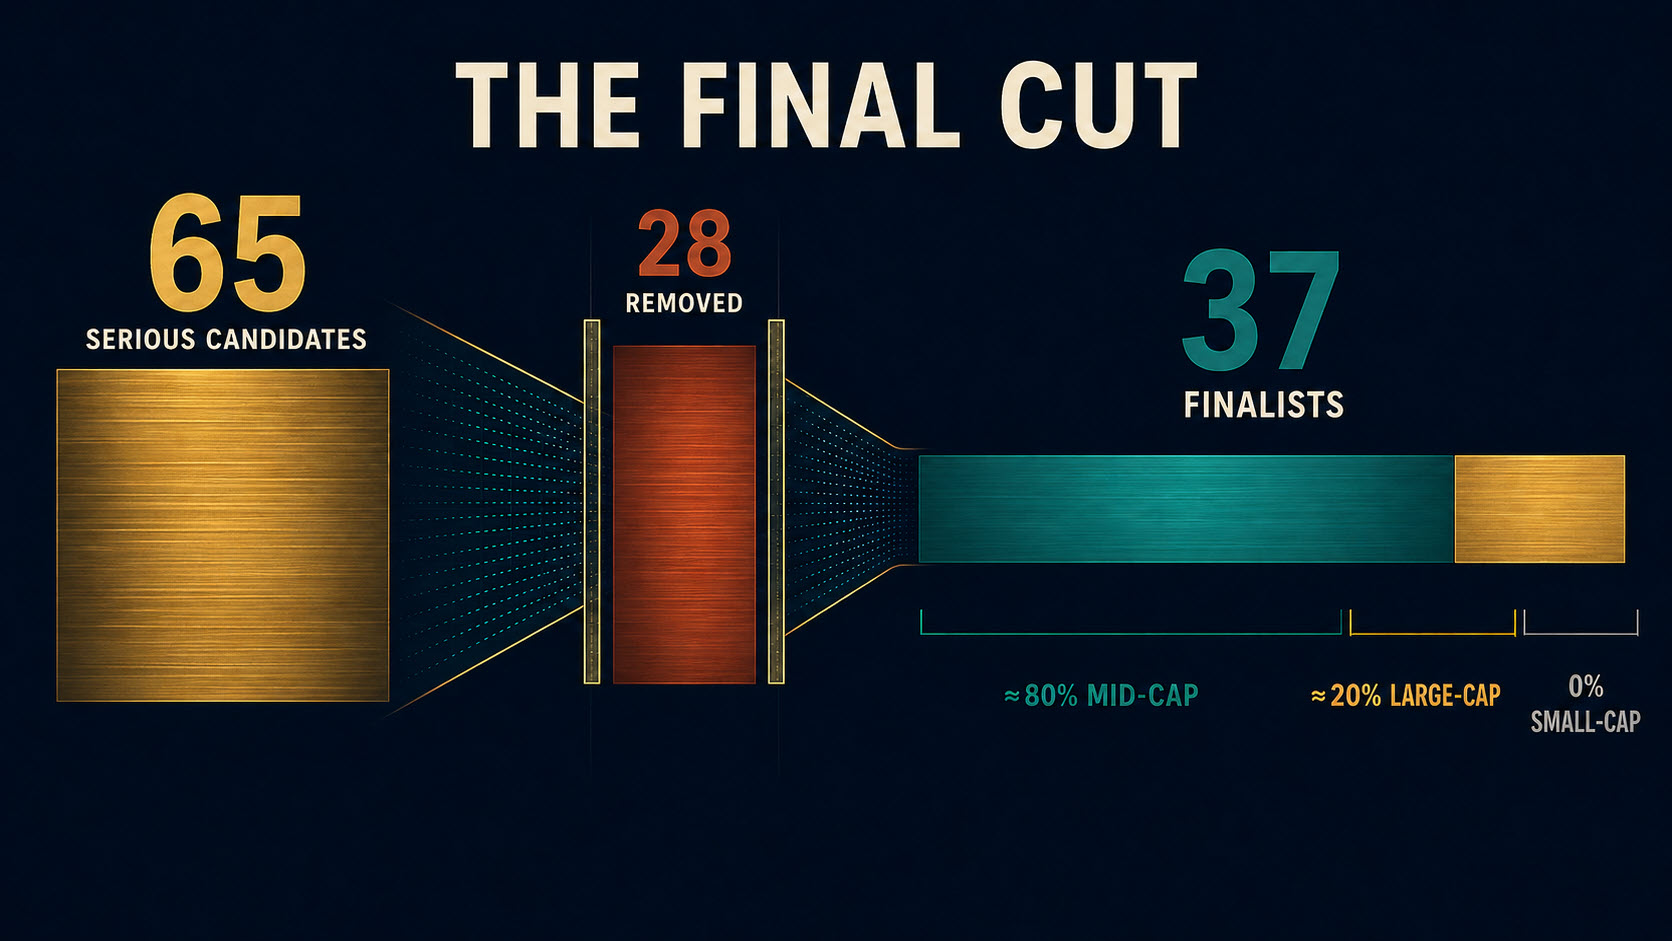
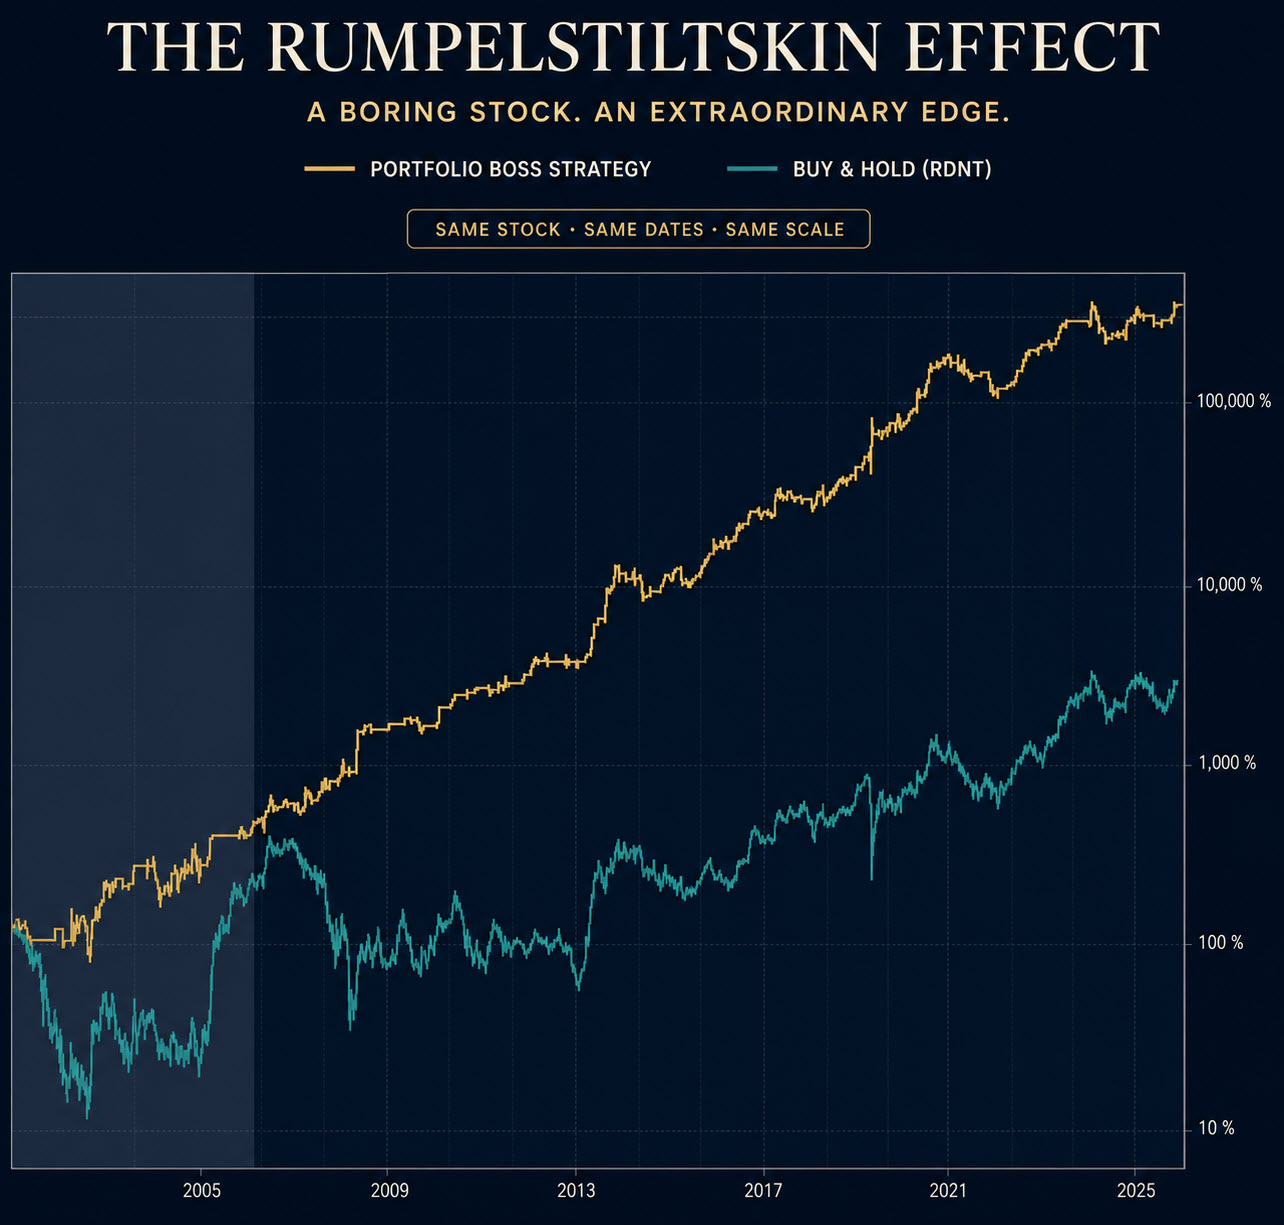
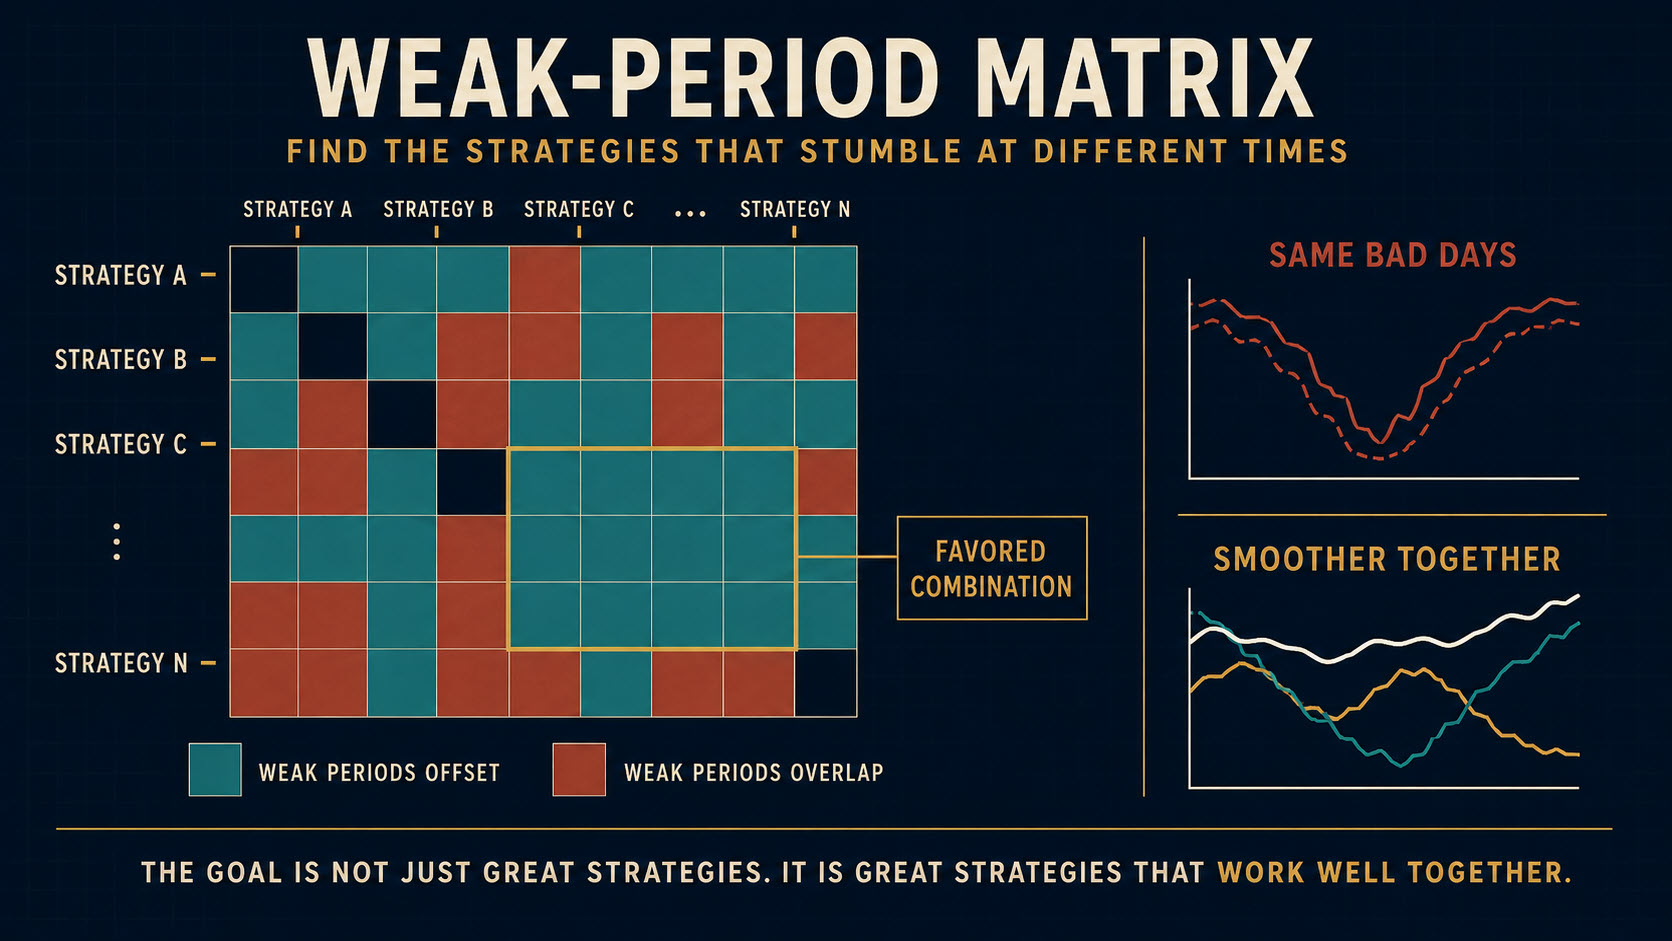
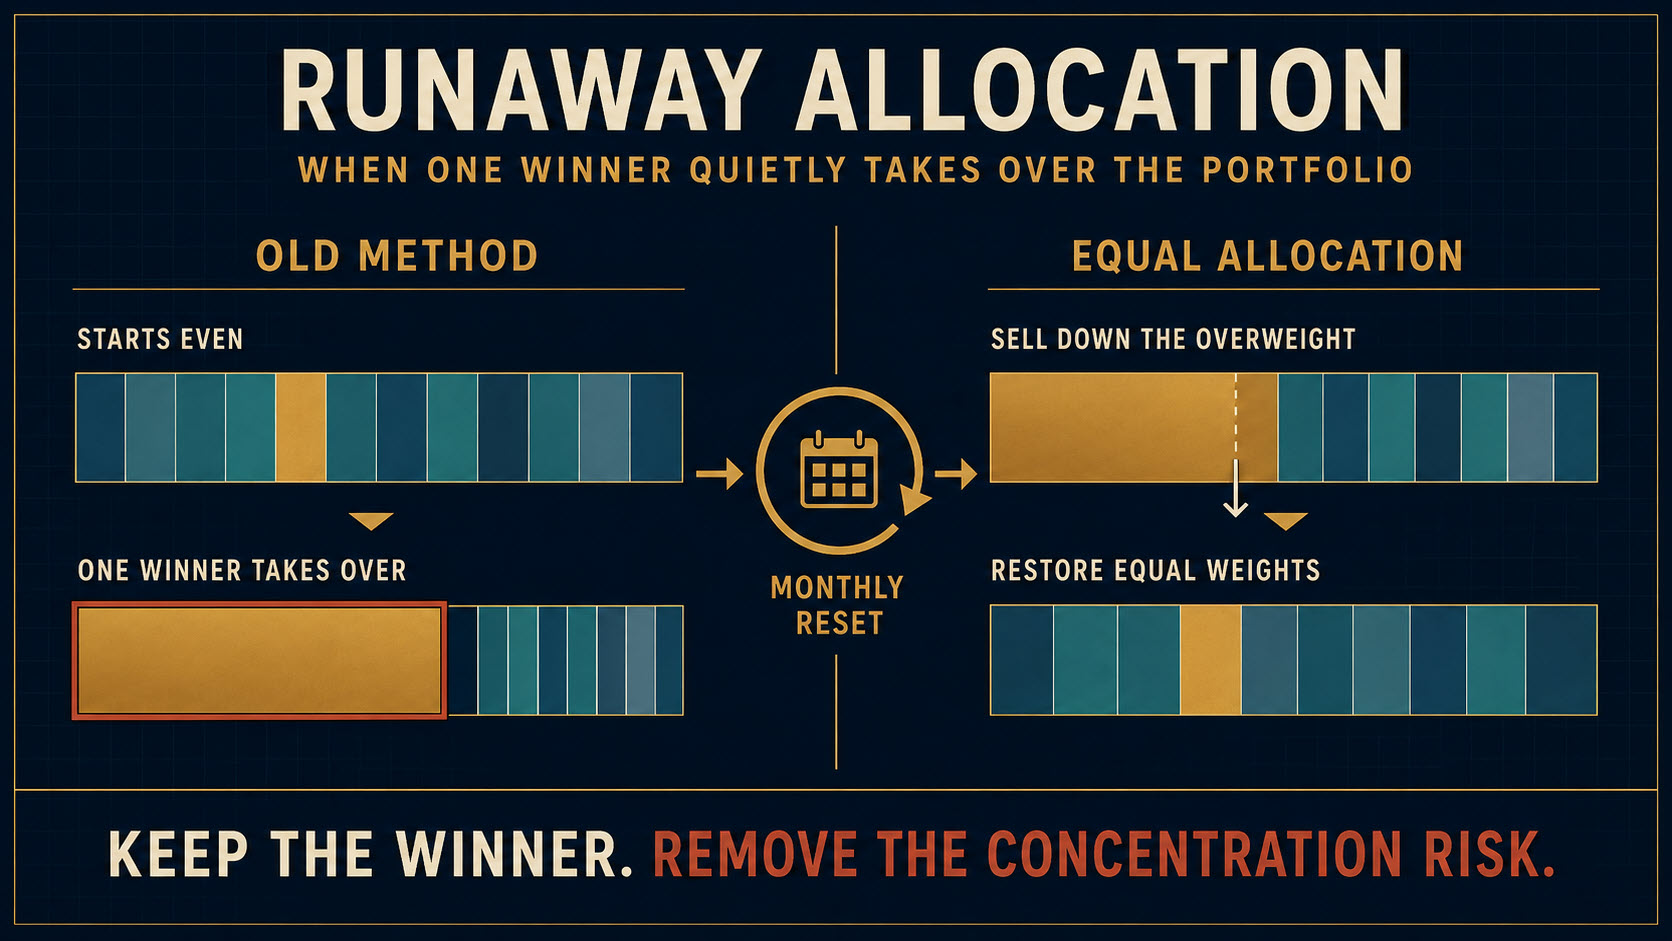
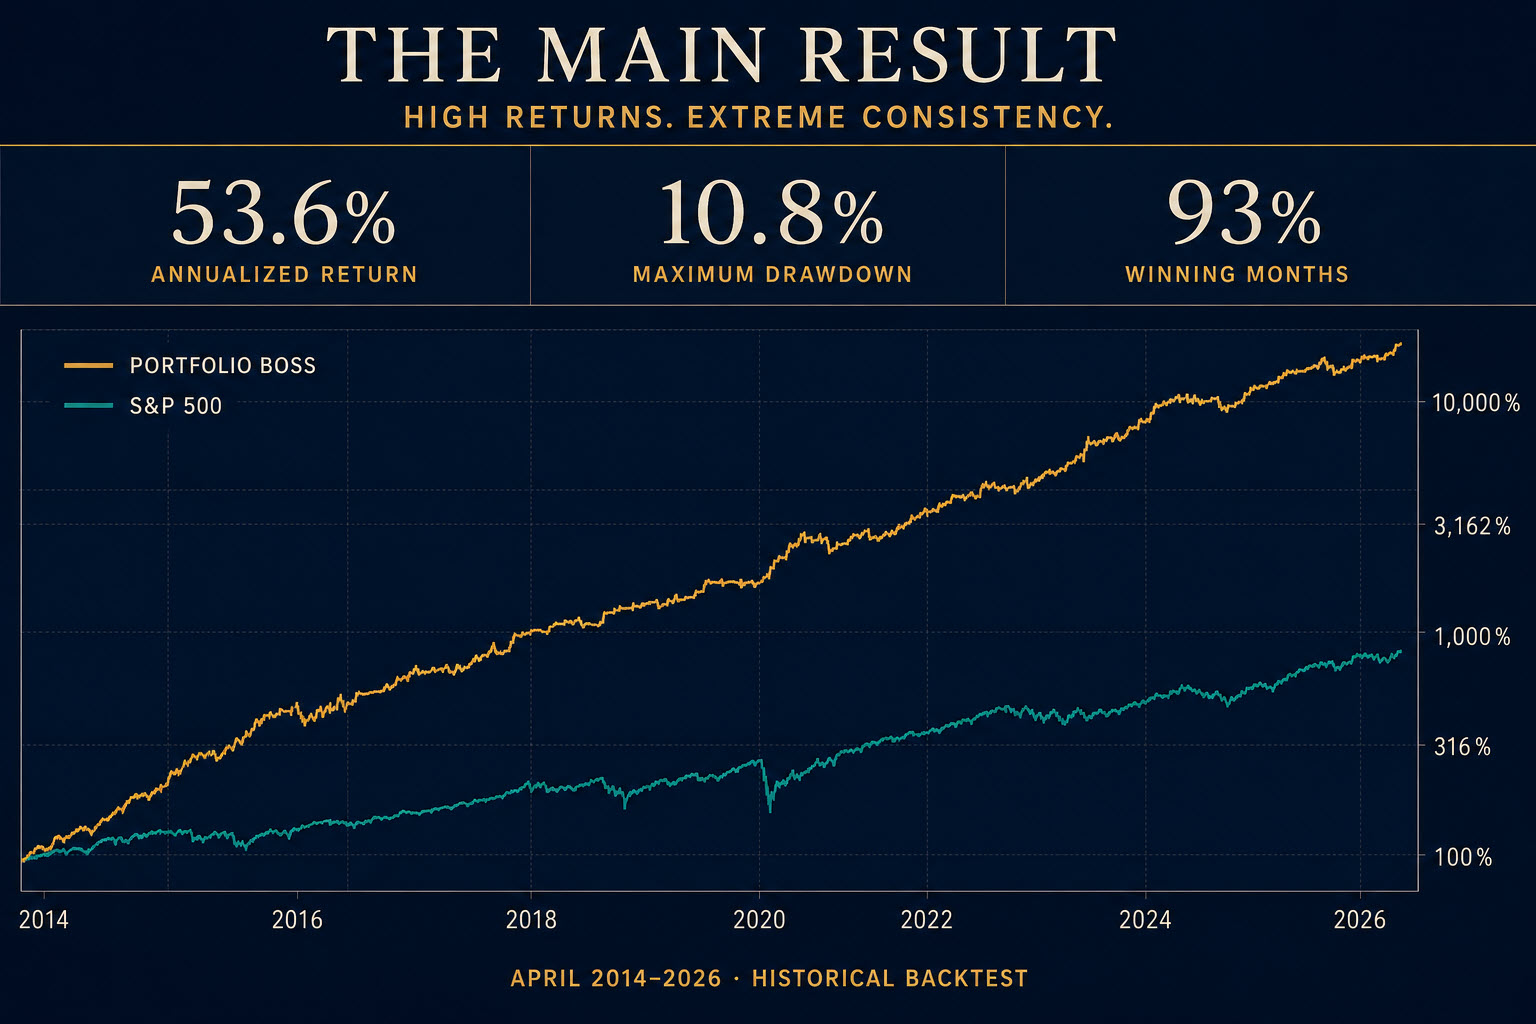
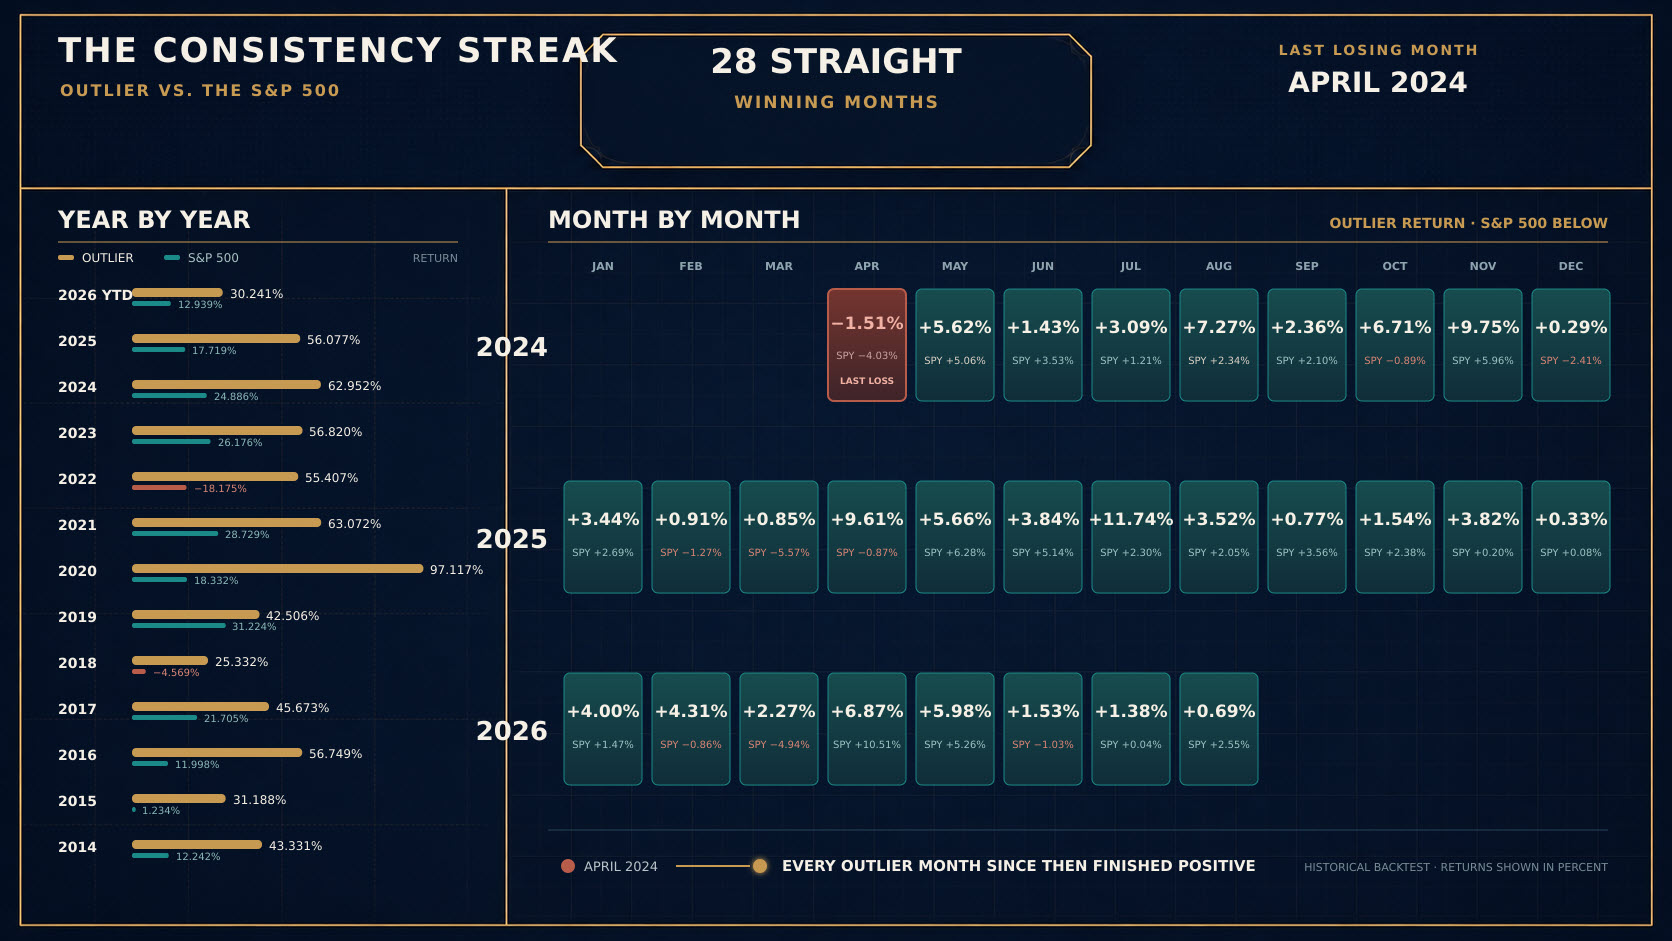
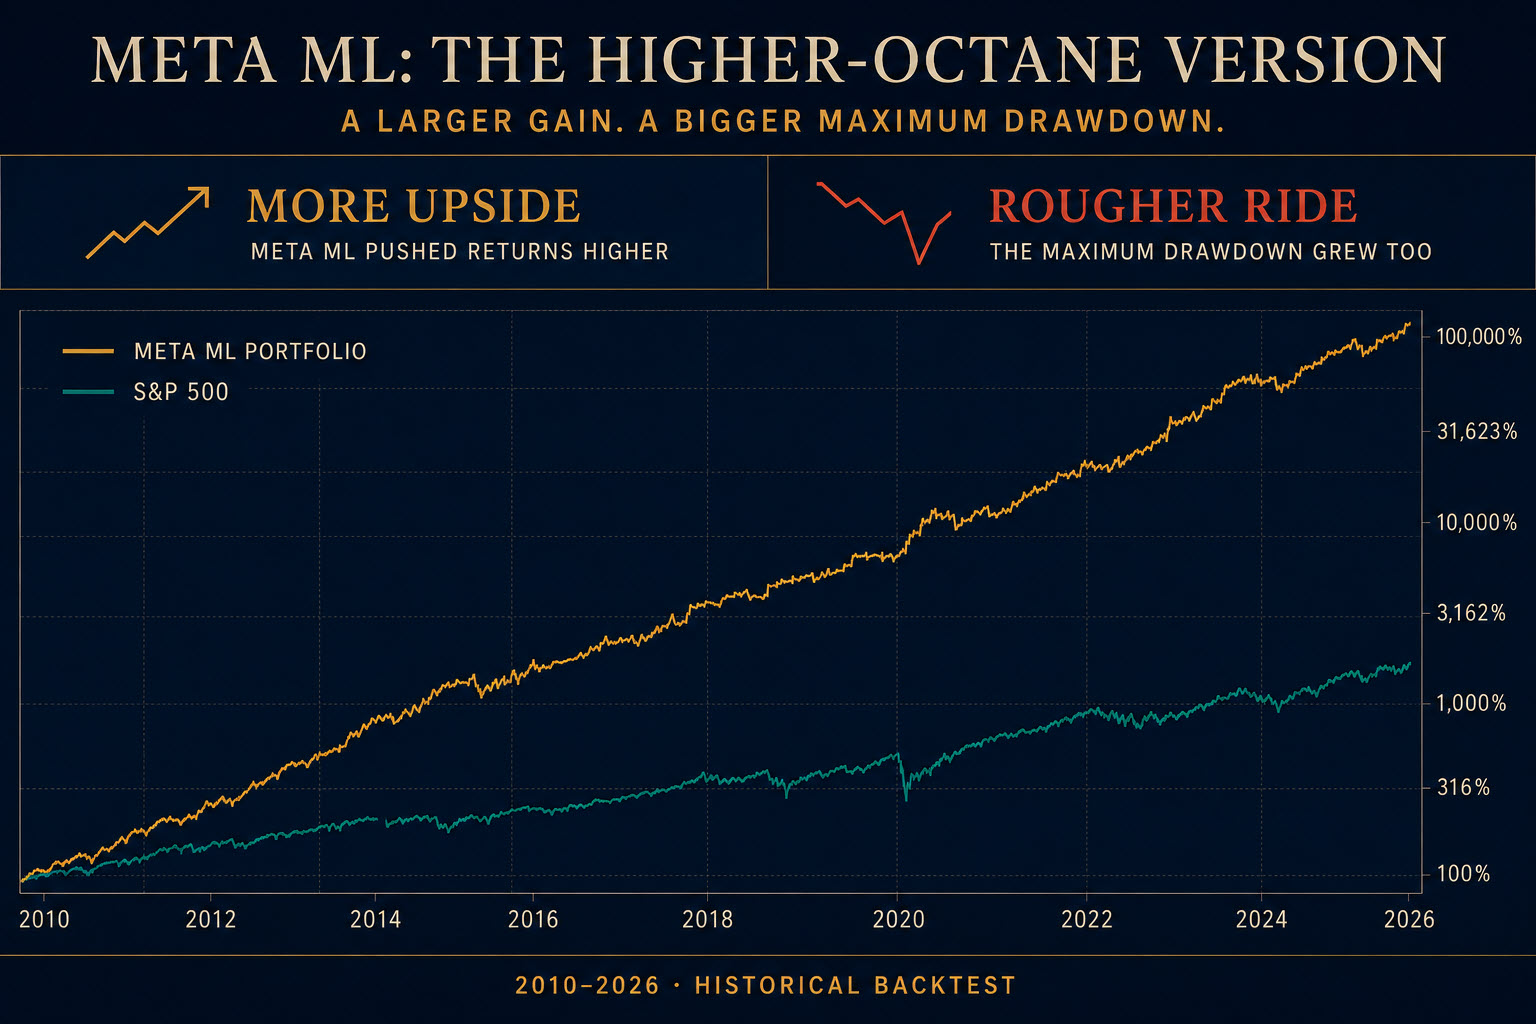
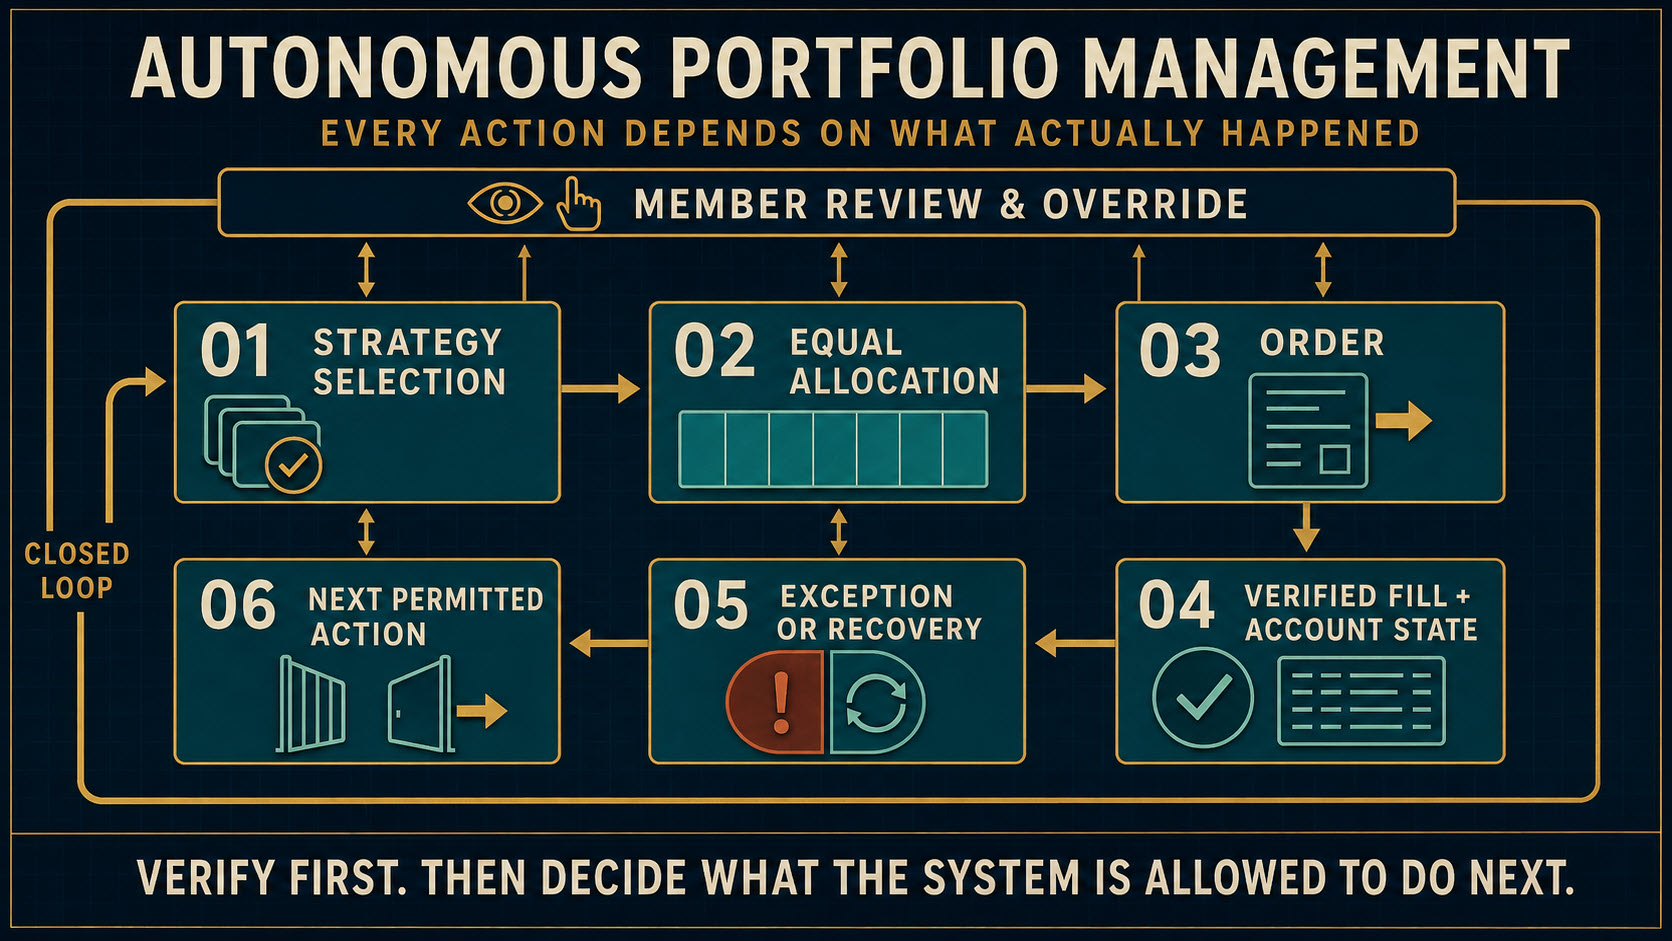
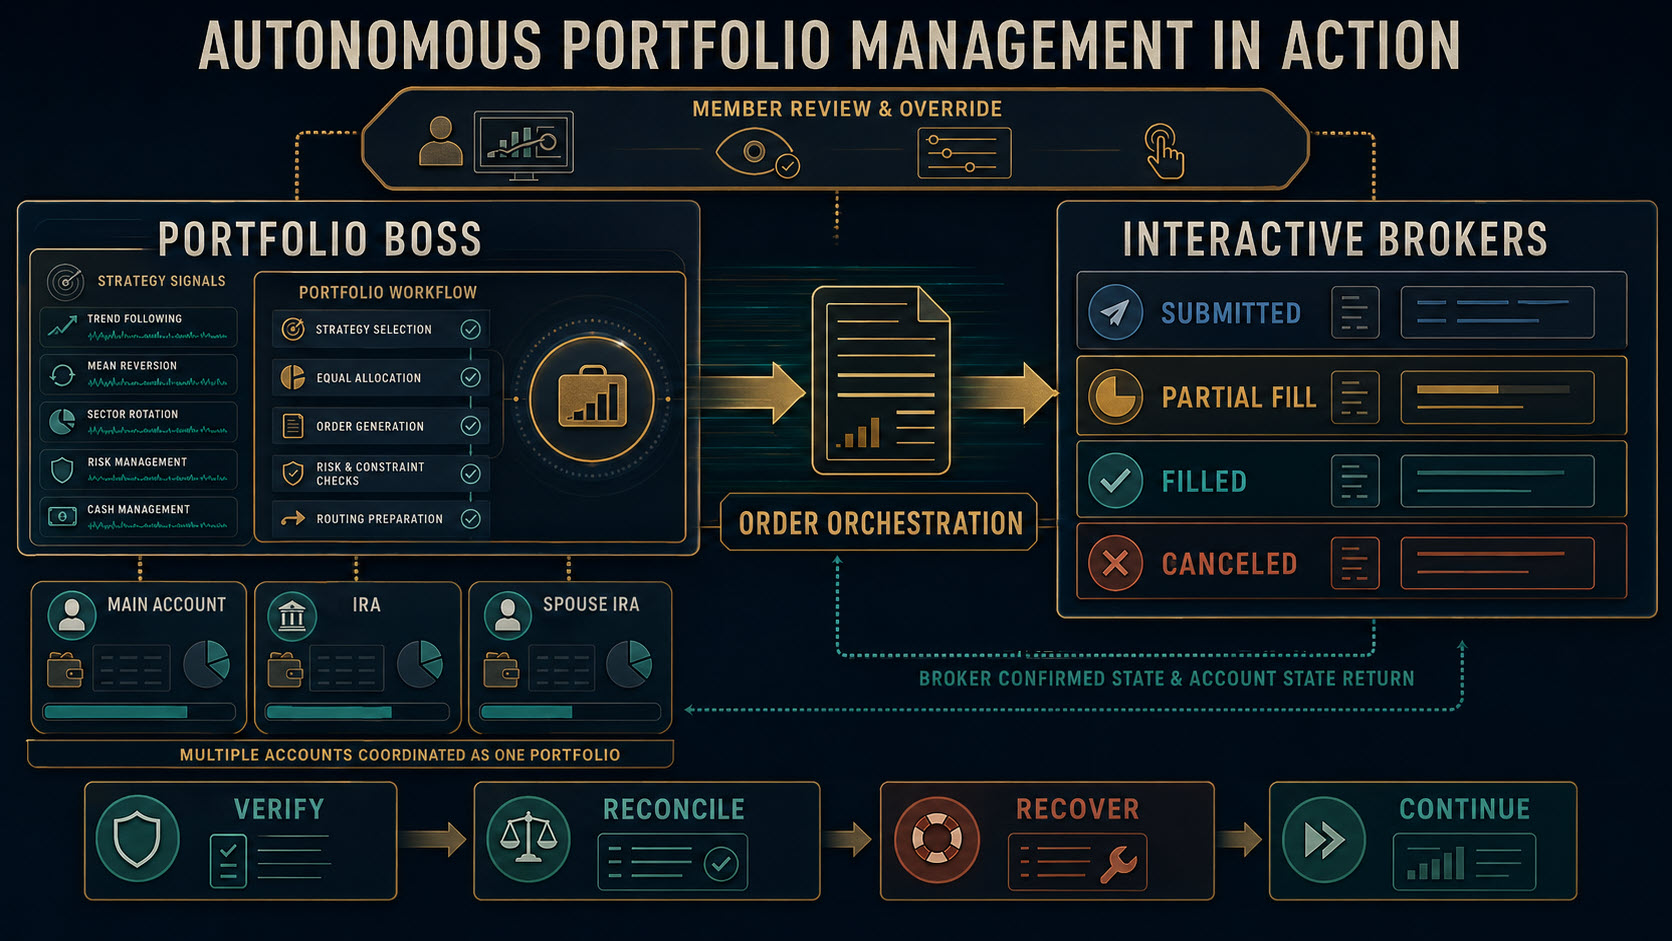
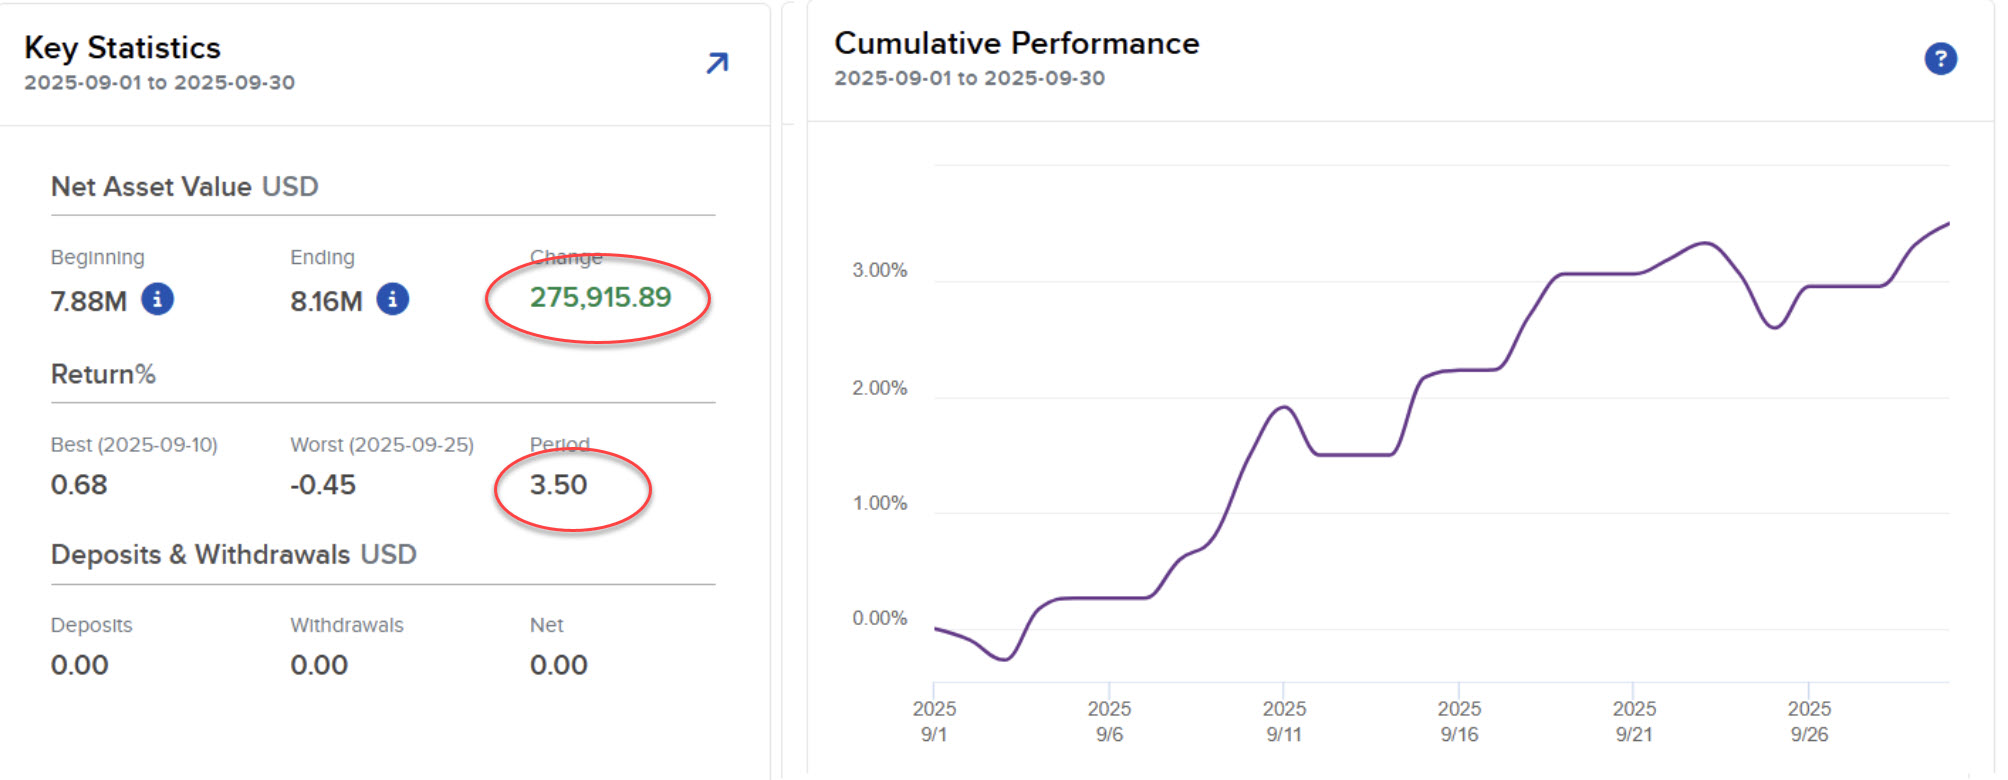 Russell’s September 2025 brokerage statement